

HTF Candles
Up to four higher timeframes rendered as mini-candles next to price, each running the same core pattern engine as the main chart.
Artemis Pro renders up to four higher timeframes as groups of mini-candles to the right of price, each running the same core pattern engine as the main chart. This page covers how the slots are configured, how to read the mini-candles, and where the HTF engine deliberately differs from the main chart.
What You See
To the right of the last bar, each enabled slot draws a compact group of candles from its timeframe — oldest on the left, the current still-forming candle on the right. Slot 1 sits closest to price, slot 4 furthest out. A slot only draws when its timeframe is actually higher than your chart timeframe.
The mini-candles speak the same visual language as the main chart: bullish candles in neon green, bearish candles in neon red, indecisive candles with the contrasting body fill, and signal candles painted in their signature colors with compact labels. If an Evening Star is completing on the 1H while you trade the 5m, you see it forming at the edge of your chart without switching timeframes.
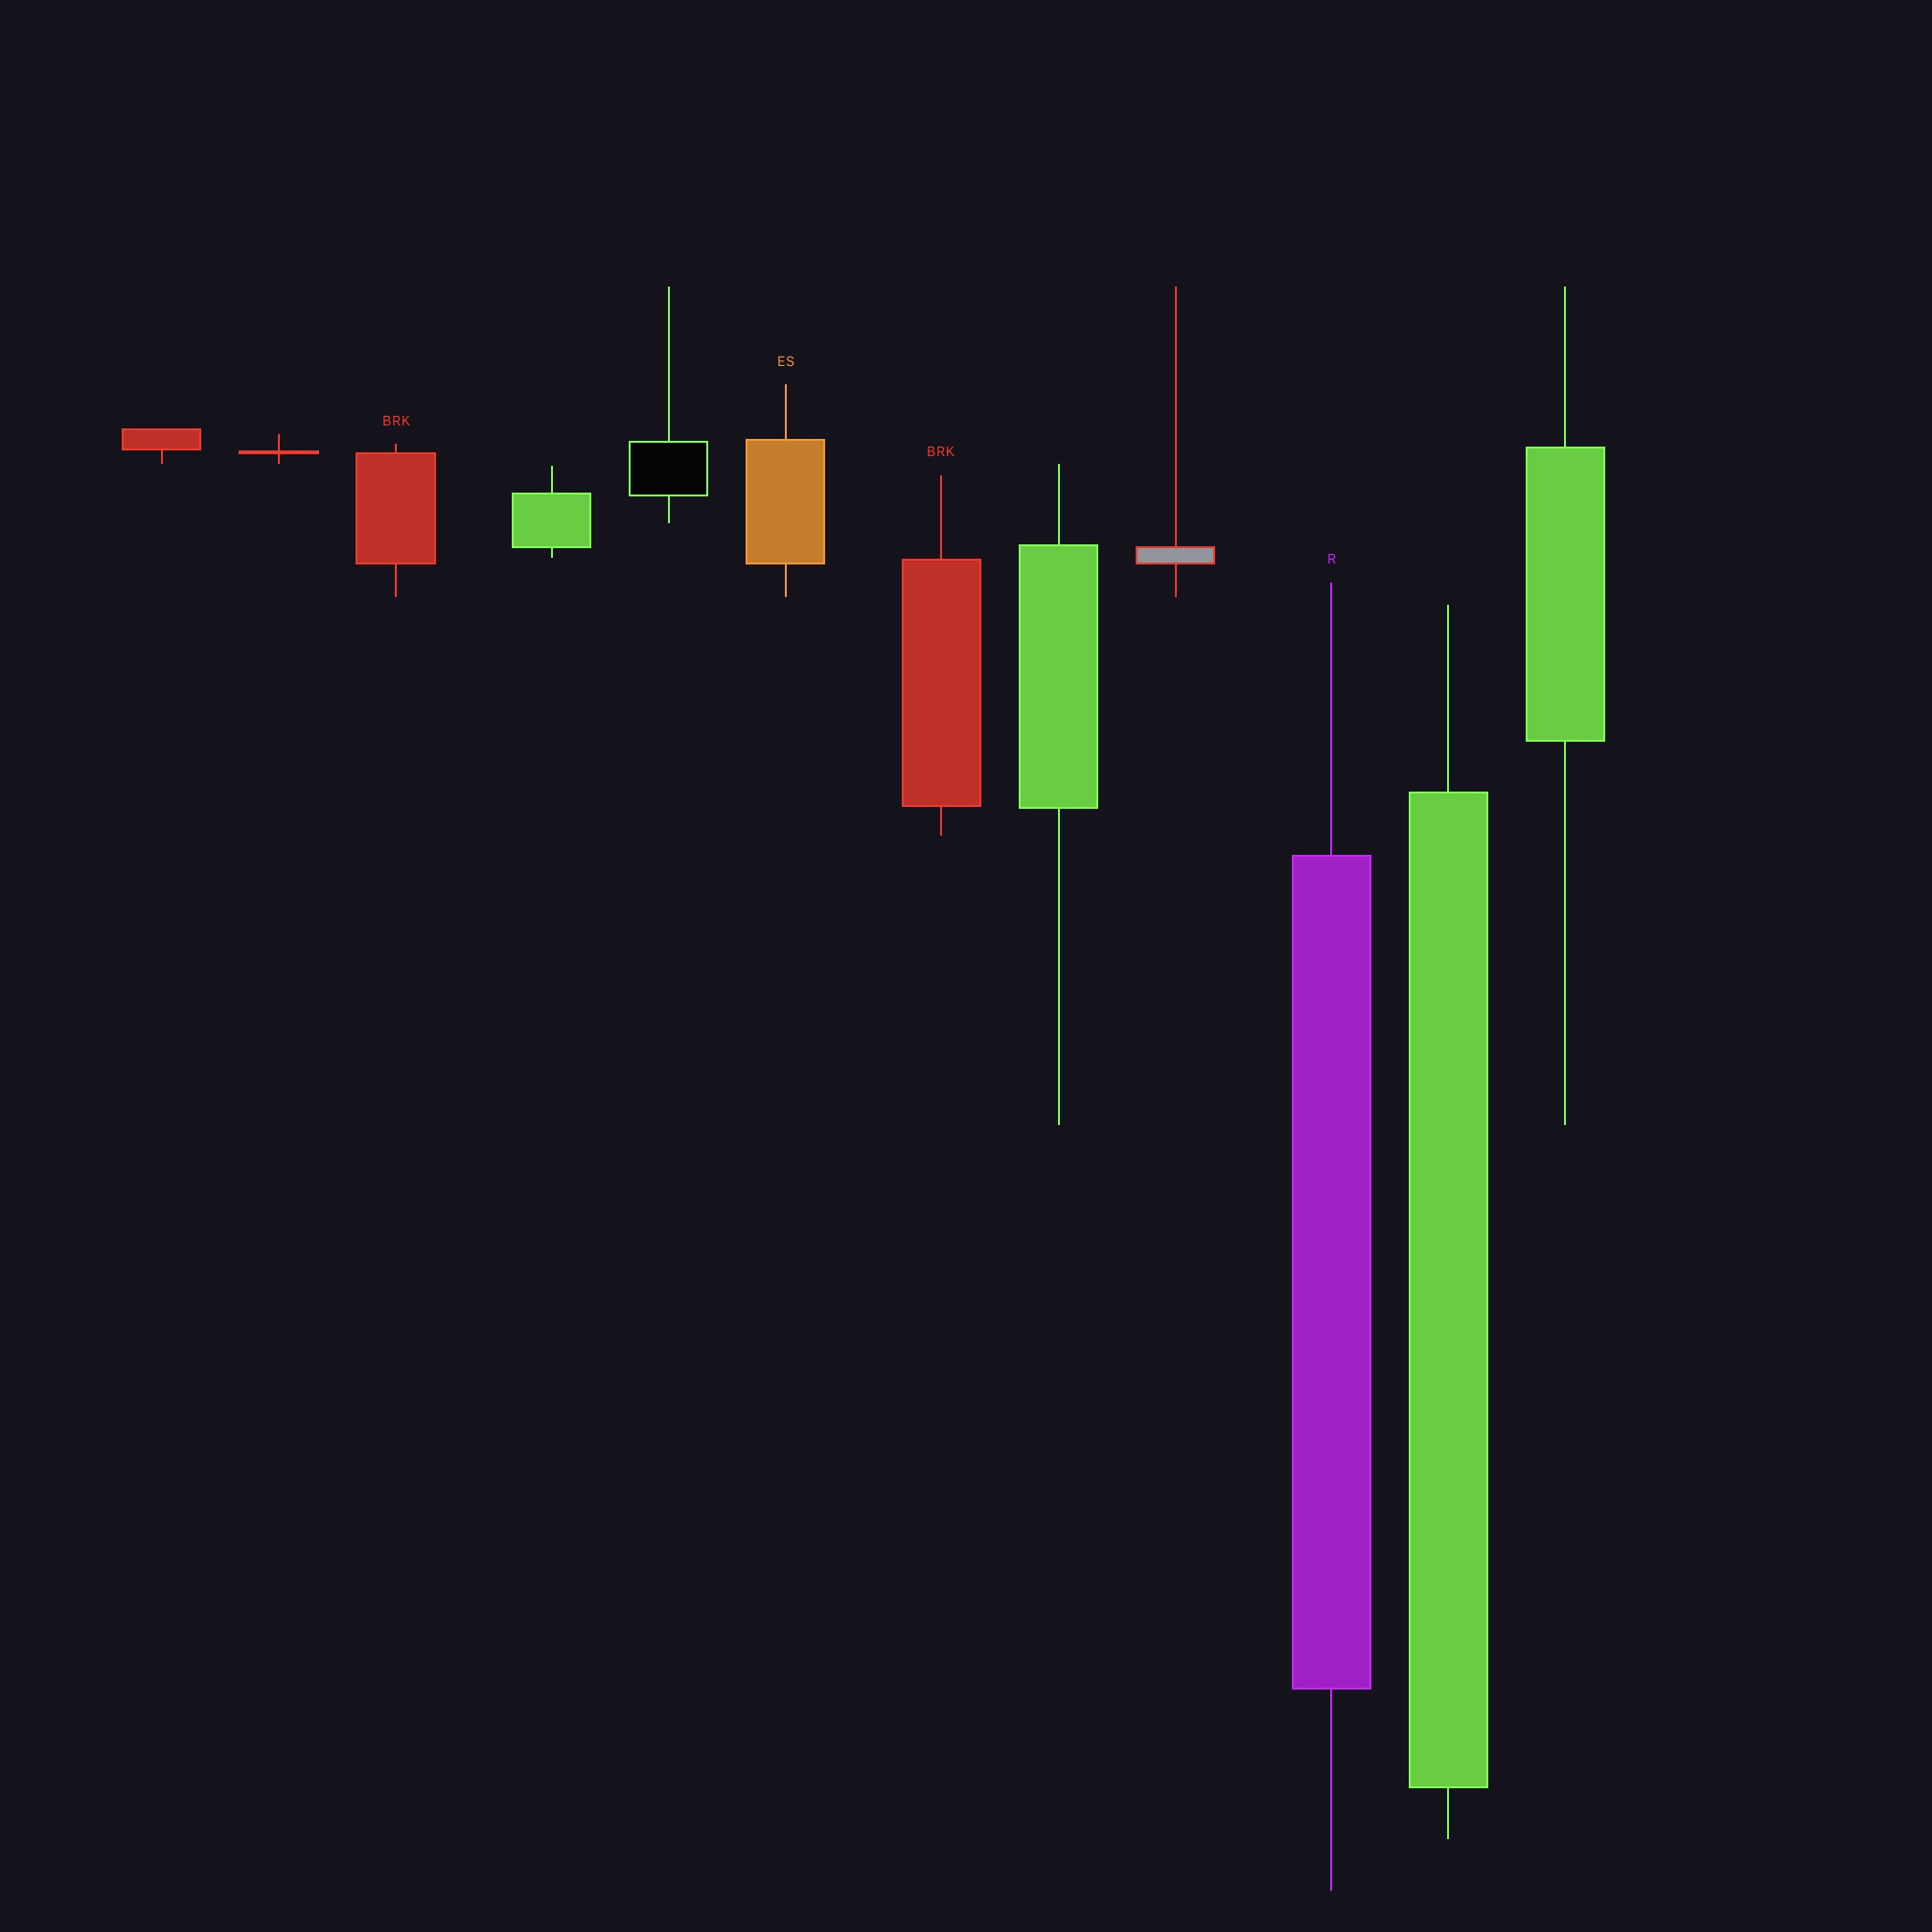
Legacy labels in this screenshot
The example above was captured on an earlier build and shows ES alongside the retired BRK and R labels. The way you read the groups is unchanged — the current HTF labels are MS, ES, TLS, HK, 3WS, 3BC, PL, TOD, and , with Bump and Run remaining chart-timeframe only. Use the for the current abbreviations.