

Liquidity Lines
Why swing levels are liquidity, how Artemis Pro detects them, and how lines are mitigated, hidden, and expired.
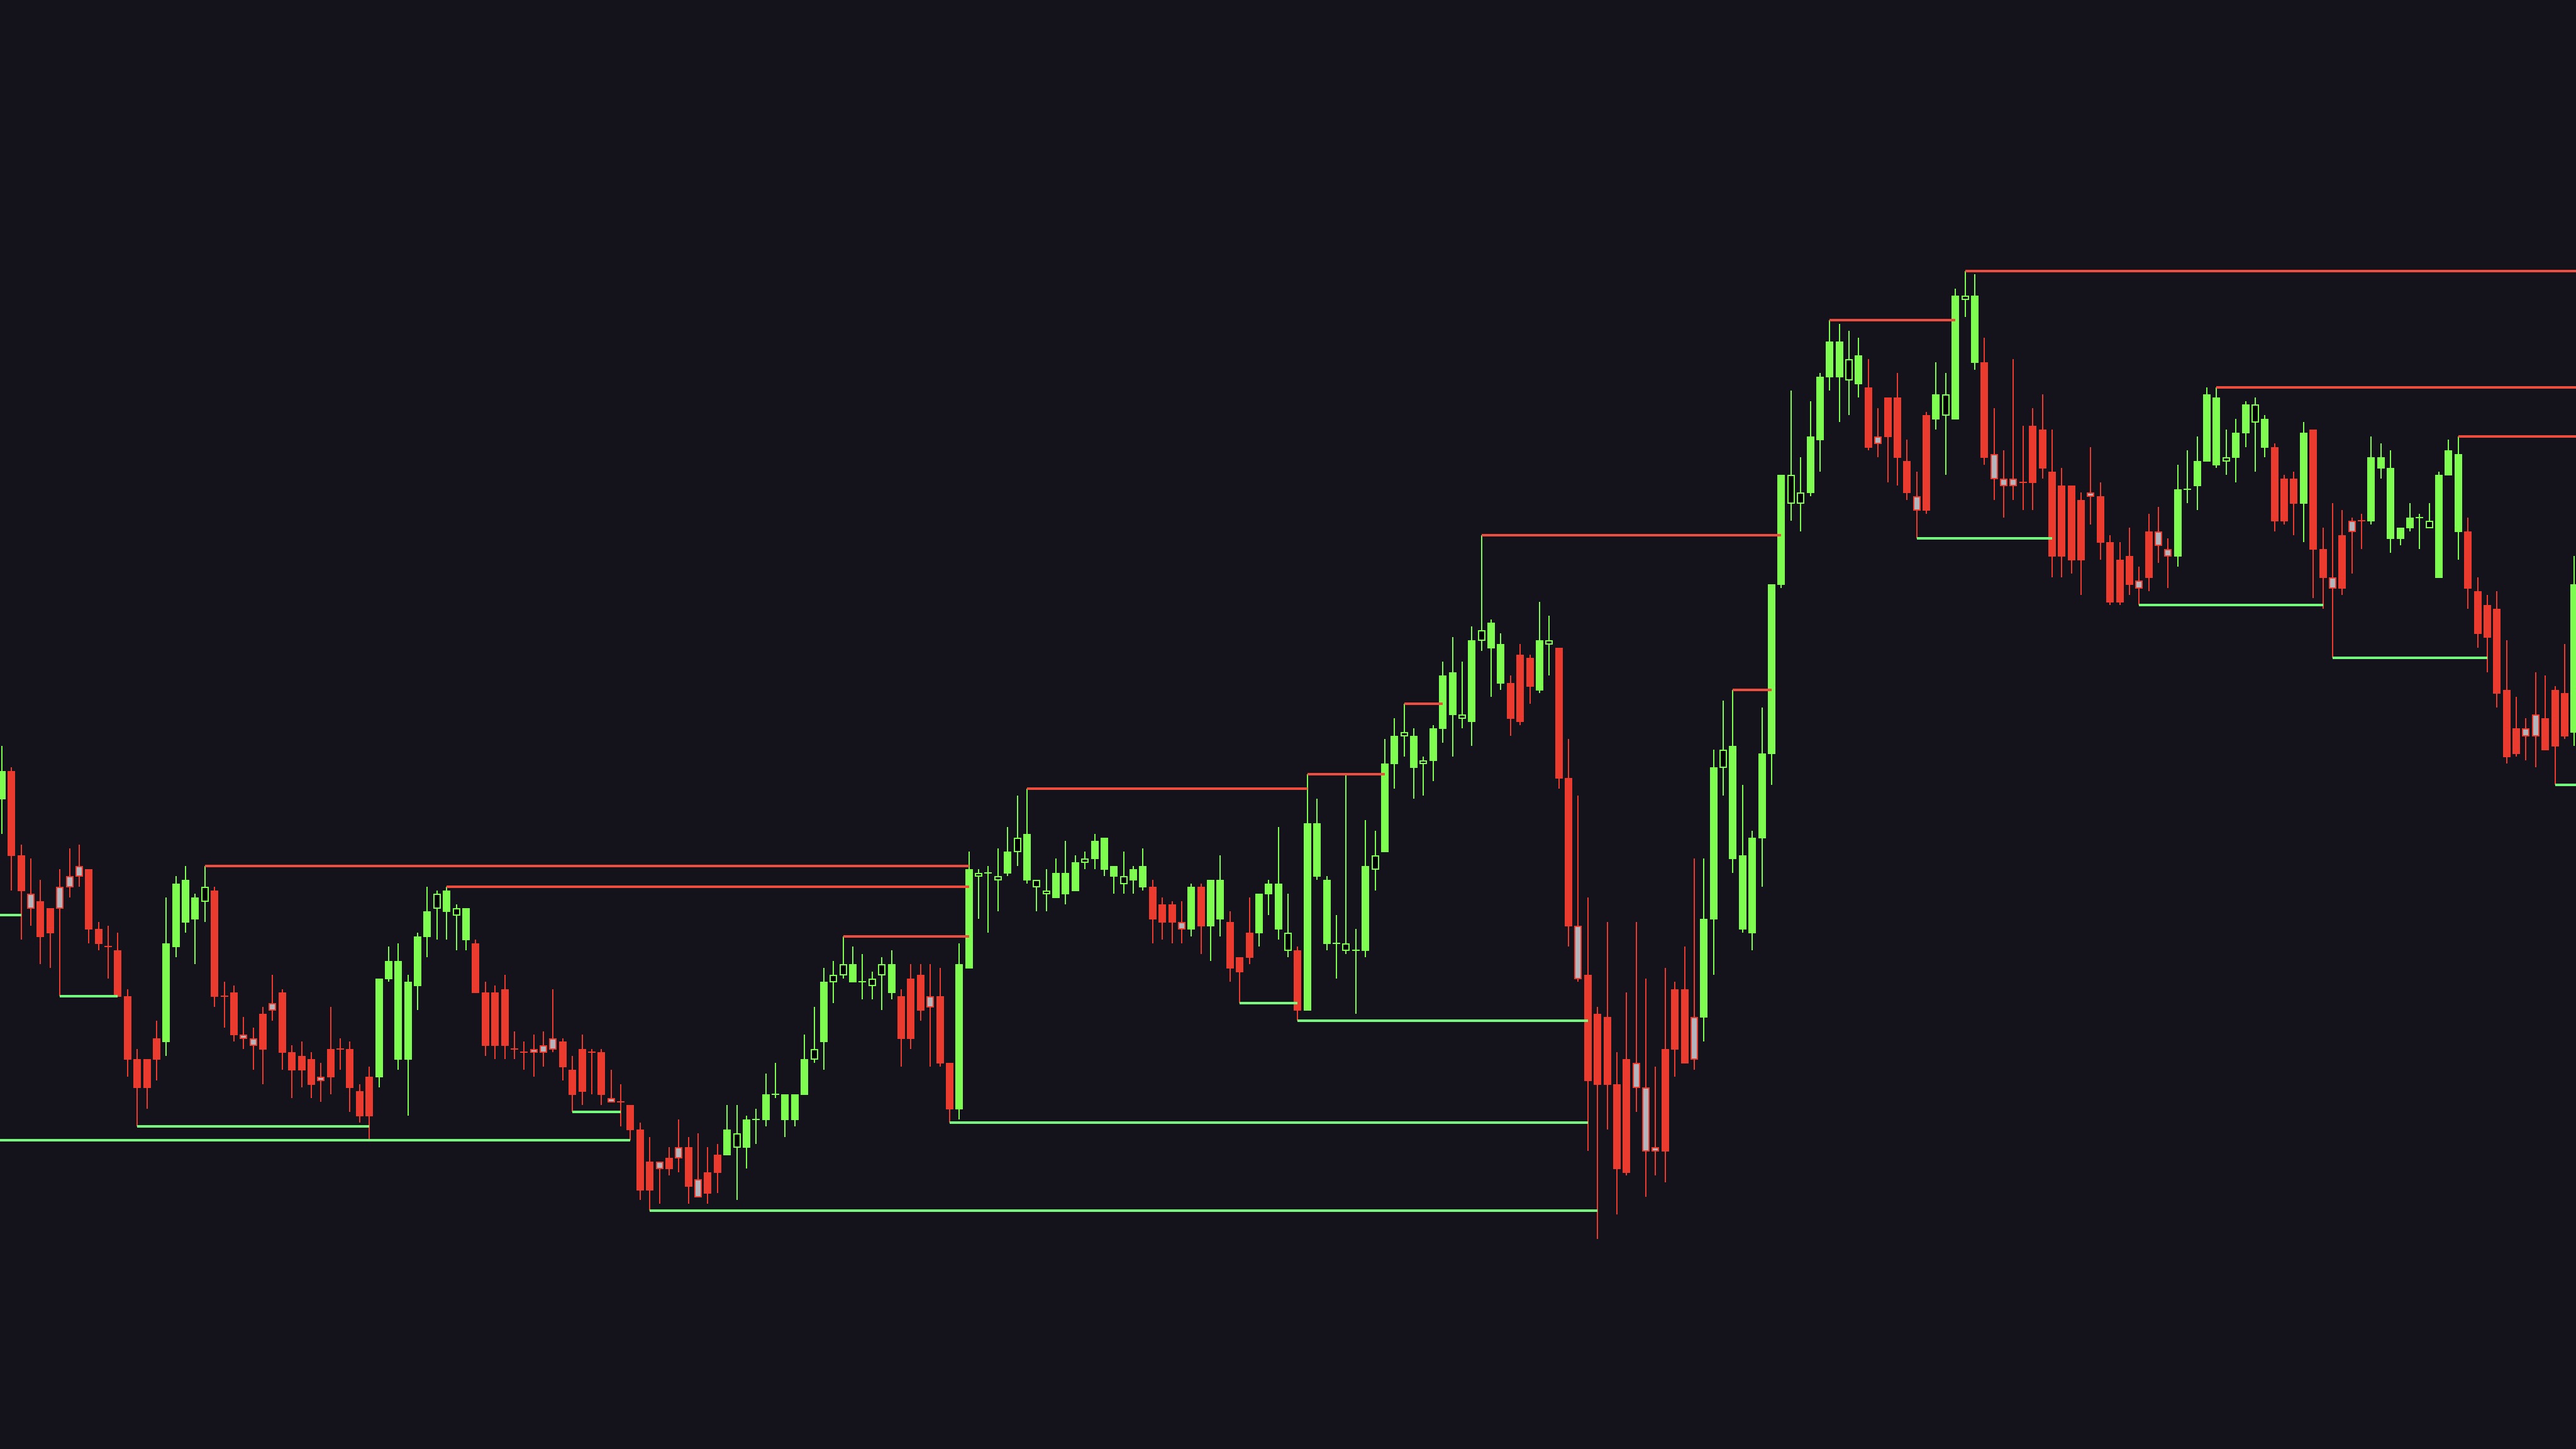
Artemis Pro marks confirmed swing highs and swing lows as horizontal liquidity lines: red resistance lines above price, green support lines below. This page explains why those levels matter, how detection works, and how lines are mitigated, hidden, and expired.
Why Swing Levels Are Liquidity
Every obvious swing high and swing low on a chart accumulates orders around it. Traders who are short place their stops just above the last swing high; traders who are long place theirs just below the last swing low. Breakout traders stack entry orders at the same prices. The result is a cluster of resting liquidity at every visible swing point.
Price is drawn to these clusters. That is why swing levels get swept, and why the sweep so often marks the turn: once the stops are triggered, the fuel is spent. Artemis Pro draws these levels for you so the map is always on the chart. What happens when price finally reaches one is covered in Liquidity Grabs.
How Detection Works
A swing is confirmed with a pivot check: a candle counts as a swing high when a set number of bars to its left and right have lower highs (mirrored for swing lows).
| Input | Default | Effect |
|---|---|---|
| Active Swing Lines | on | Master switch for the module |
| Bars Left | 10 | Bars to the left that must be lower (highs) or higher (lows). More bars means only larger swings qualify. |
| Bars Right | 3 | Bars to the right needed for confirmation. More bars means later but more reliable detection. |
| Res Lines / Sup Lines | red / green | Line colors for swing highs and swing lows |
| Width | 2 | Line width |
When a swing is confirmed, the line is drawn starting at the actual pivot candle, so it sits at the historically correct bar and price.