ChartMystic
  • How it works
  • Products
  • Live demo
  • Results
  • Pricing
  • Docs
Log inSign up
  • How it works
  • Products
  • Live demo
  • Results
  • Pricing
  • Docs
  • Log in

Documentation

Artemis Pro

InstallationOverviewHow Artemis Pro ThinksReading The ChartTrend EngineSignal ReferenceLiquidity LinesLiquidity GrabsSession BoxesHTF LevelsHTF CandlesHTF Info TableBacktesting And Data WindowSupported Markets And ChartsSettings ReferenceFAQGlossary

Scribe Studio

OverviewAsk for a StrategyPerformanceTrade AnalysisCodeTweaking Your StrategyTransfer to TradingViewThe Strategy LibraryHistory & Saved StrategiesFAQGlossary
ChartMystic
Documentation/Artemis Pro/Session Boxes

Session Boxes

Asia, London, and New York session boxes with first-hour opening ranges, projected session high and low lines, and the New York after-hours extension.

Artemis Pro draws the three sessions that structure the trading day: Asia, London, and New York. Each session gets an opening range box for its first hour and dashed lines that project that range's high and low across the whole session.

The Three Sessions

SessionWindowTime zoneDefault
Asia00:30–07:00UTCon
London08:00–16:30Europe/Londonon
New York09:30–16:00America/New_Yorkon
New York after-hours extension16:00–17:00America/New_Yorkon

Each session has its own toggle and its own session-string input, so you can switch any of them off or reshape the windows without touching the others. The after-hours extension is not a fourth session: it carries the New York opening range levels past the close, and it has its own toggle and window too.
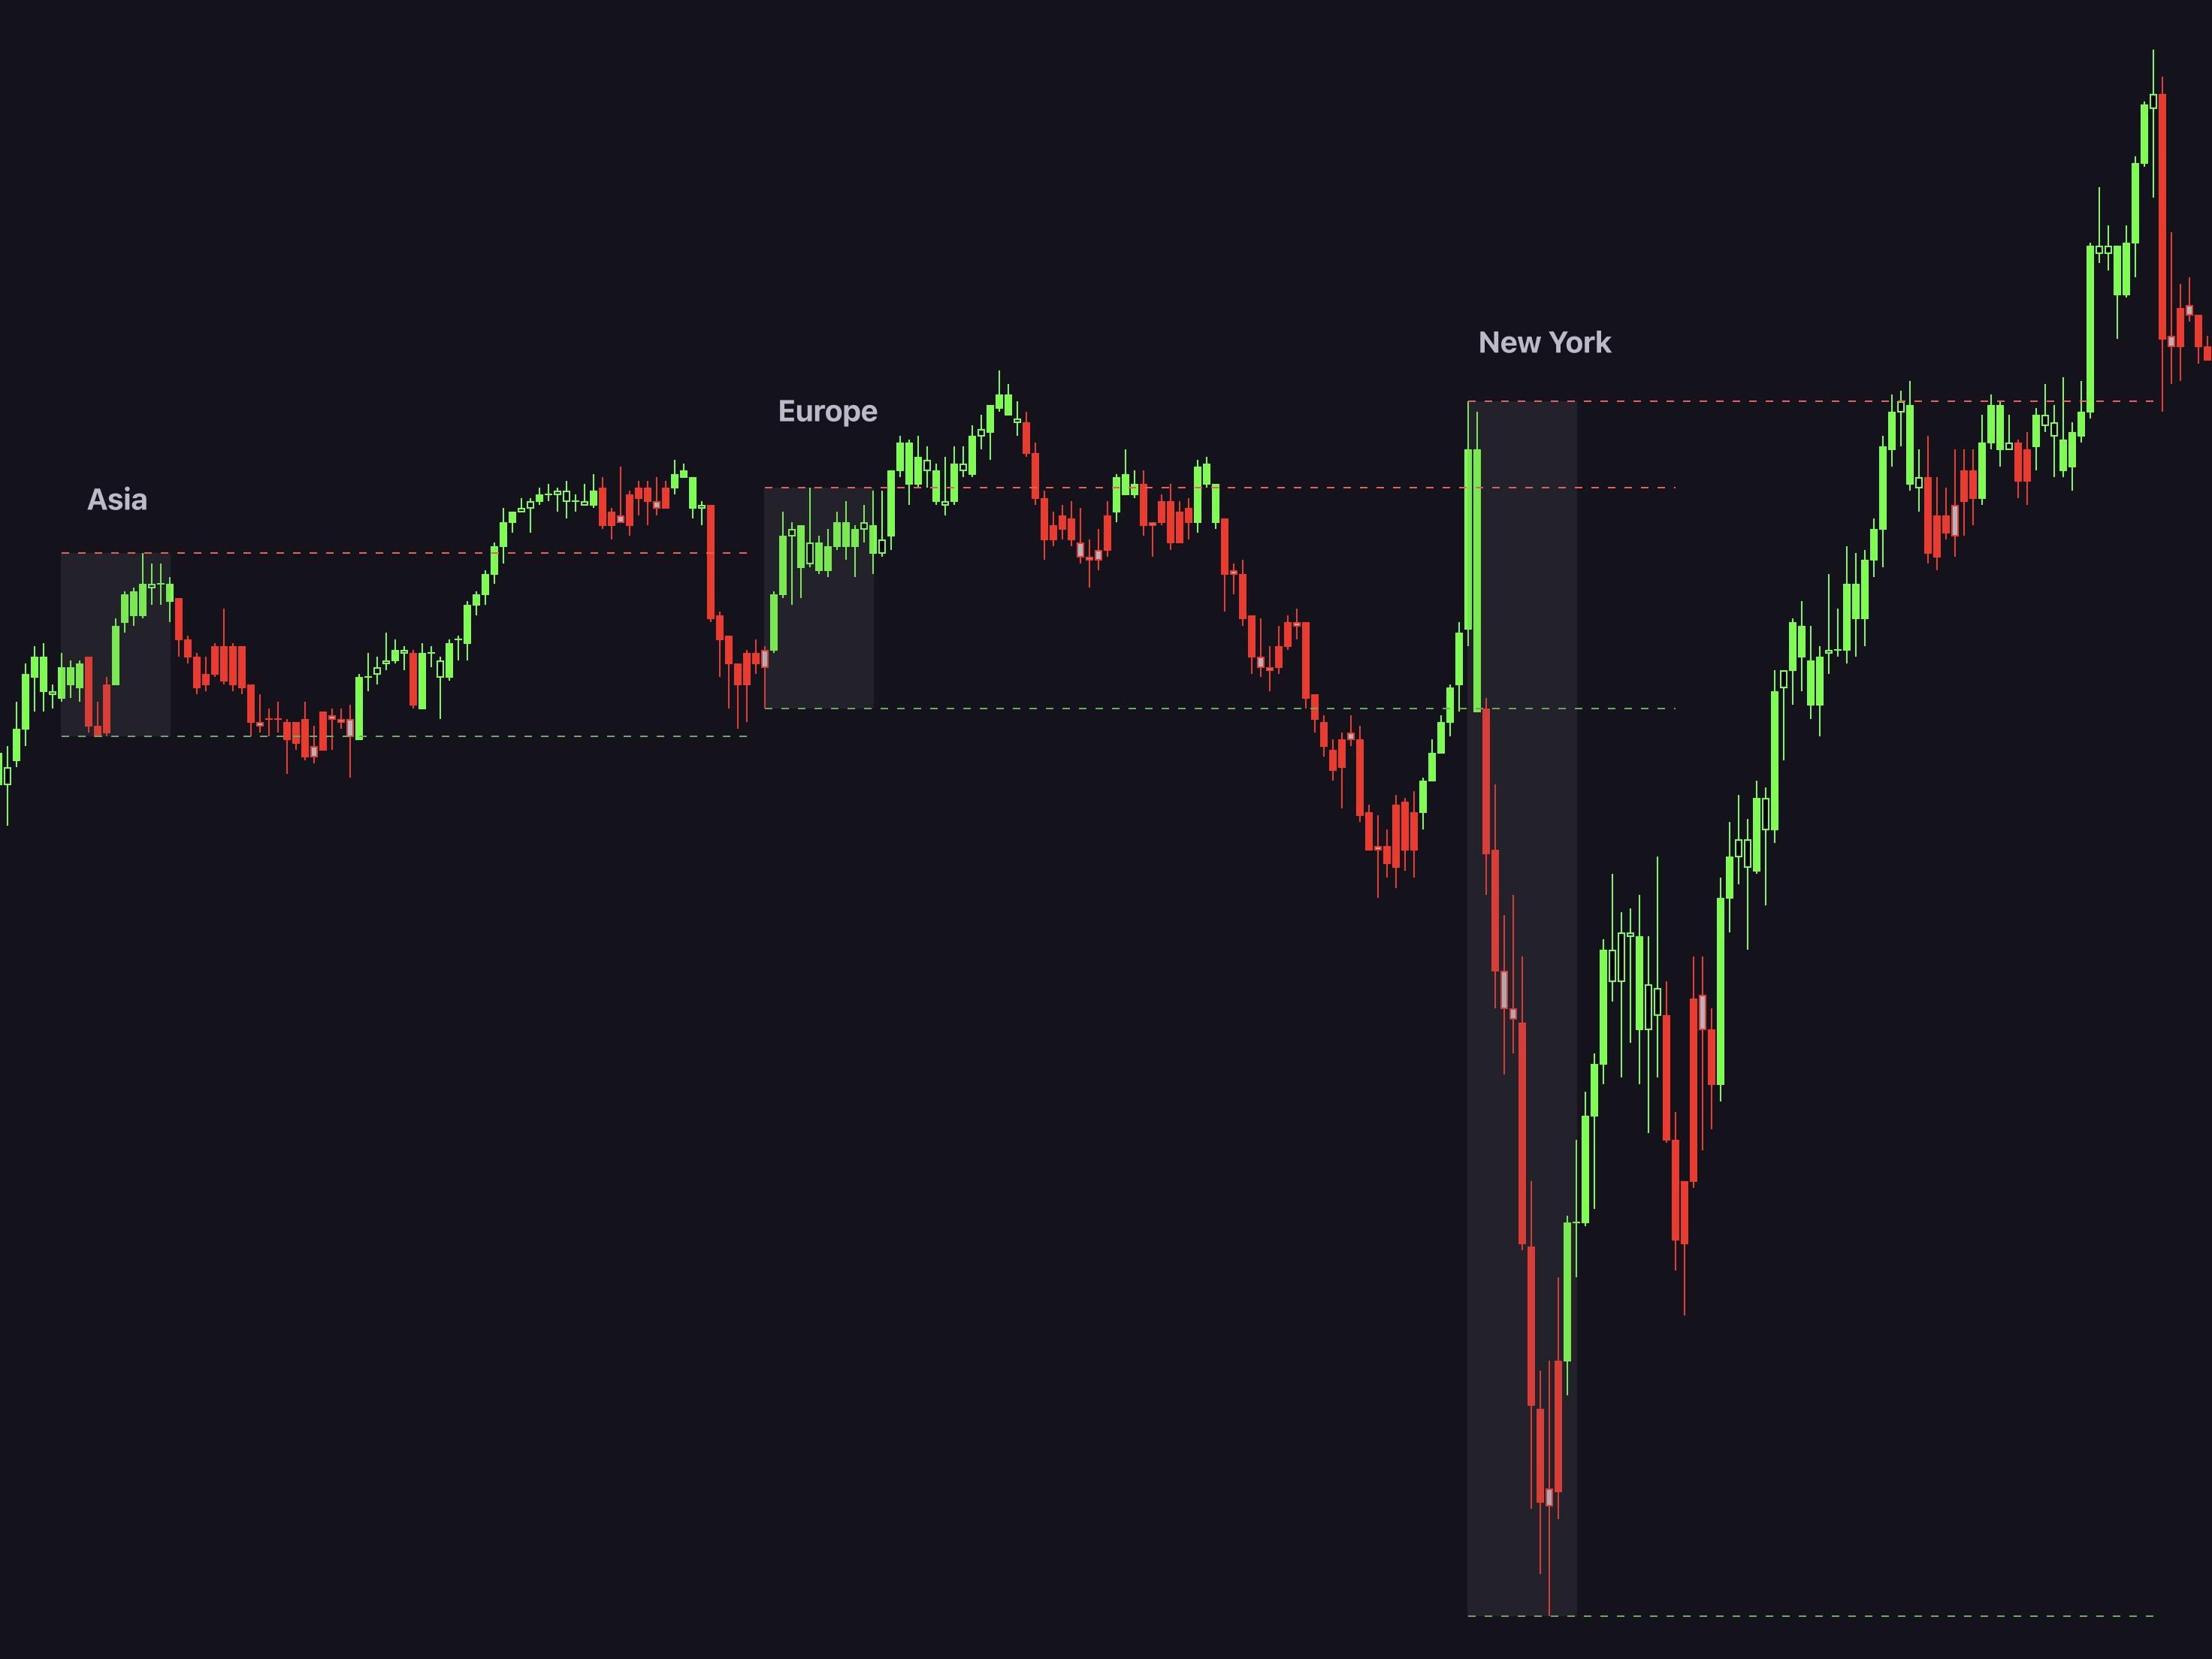
The volatility hierarchy across the three sessions
Screenshot
5-minute S&P 500 futures chart with the three Artemis Pro session boxes and dashed session high and low lines — Asia forms the smallest range, Europe a medium-sized range, and New York by far the largest

What Gets Drawn

When a session opens, Artemis Pro starts two things:

  • The opening range box. For the first 60 minutes of the session, a gray-filled box tracks the running high and low. After the first hour, the box stops growing: that rectangle is the session's opening range.

  • Opening range high and low lines. Two dashed horizontal lines, red for the opening range high and green for the opening range low, extend from the session open through the entire session. Once the first hour is over, they stay fixed at the opening range extremes, projecting them forward as the session's reference levels.

  • The New York after-hours extension. When the New York session closes at 16:00, its opening range high and low lines keep going as dotted, more transparent lines until 17:00 New York time. Dashed means the main session, dotted means after-hours. Only the two levels extend; the opening range box itself ends with the session.

PreviousLiquidity GrabsNextHTF Levels

Need help?

Colors for the high line, low line, and box fill are configurable in the Session Boxes settings group, and the after-hours extension has its own toggle and window there.

Reading The Sessions

Each session tends to play a distinct role in the daily rhythm:

  • Asia builds the overnight range and is usually the least volatile of the three sessions. Its range is typically the smallest, and its high and low become the first liquidity magnets of the day.
  • London (Europe) usually sits in the middle of the volatility ladder: more active than Asia, but less volatile than New York. It often runs one side of the Asia range early in its session. A sweep of the overnight high or low that immediately fails is one of the cleanest reversal contexts of the day.
  • New York is usually by far the most volatile session and carries the highest volume, especially while London is still open. Its opening range is the frame for the rest of the US session: a decisive break and hold beyond the range in the bias direction reads as continuation, while a sweep of a range extreme that closes back inside reads as reversal.

The opening range edges behave like the swing levels on your chart: stops collect beyond them, which makes them prime territory for the sweep-and-fail behavior described in Liquidity Grabs.

Pair the sessions with the day open

Keep the current day open (CDO) from HTF Levels visible alongside the session boxes. Where price sits relative to the day open tells you the intraday lean; the session ranges tell you where that lean gets tested.

Time Zones And Other Instruments

Each session window is interpreted in its market's own time zone — fixed inside the indicator and independent of your chart's time zone. The London session follows Europe/London, and New York and its after-hours extension follow America/New_York, which means daylight saving shifts are handled for you. The Asia window is defined in UTC. The time zones themselves are not editable settings.

The defaults assume instruments with meaningful Asia, London, and New York activity. On markets that trade around the clock, the session structure still matters because it follows when the major trading centers are active. For instruments with different active hours, edit the session strings to match that market (each window is still interpreted in its fixed home time zone), or switch off sessions that carry no meaning for it. See Supported Markets And Charts for per-market guidance.