HTF Levels
The weekly highs and lows and the current day open: what each tag means, why the level matters intraday, and exactly how each one updates.
Artemis Pro keeps a small set of higher-timeframe reference levels on your intraday chart: the current week's and previous week's highs and lows, plus the current day open. This page explains what each tag means, why the level matters intraday, and exactly how each level updates.
The Tracked Levels
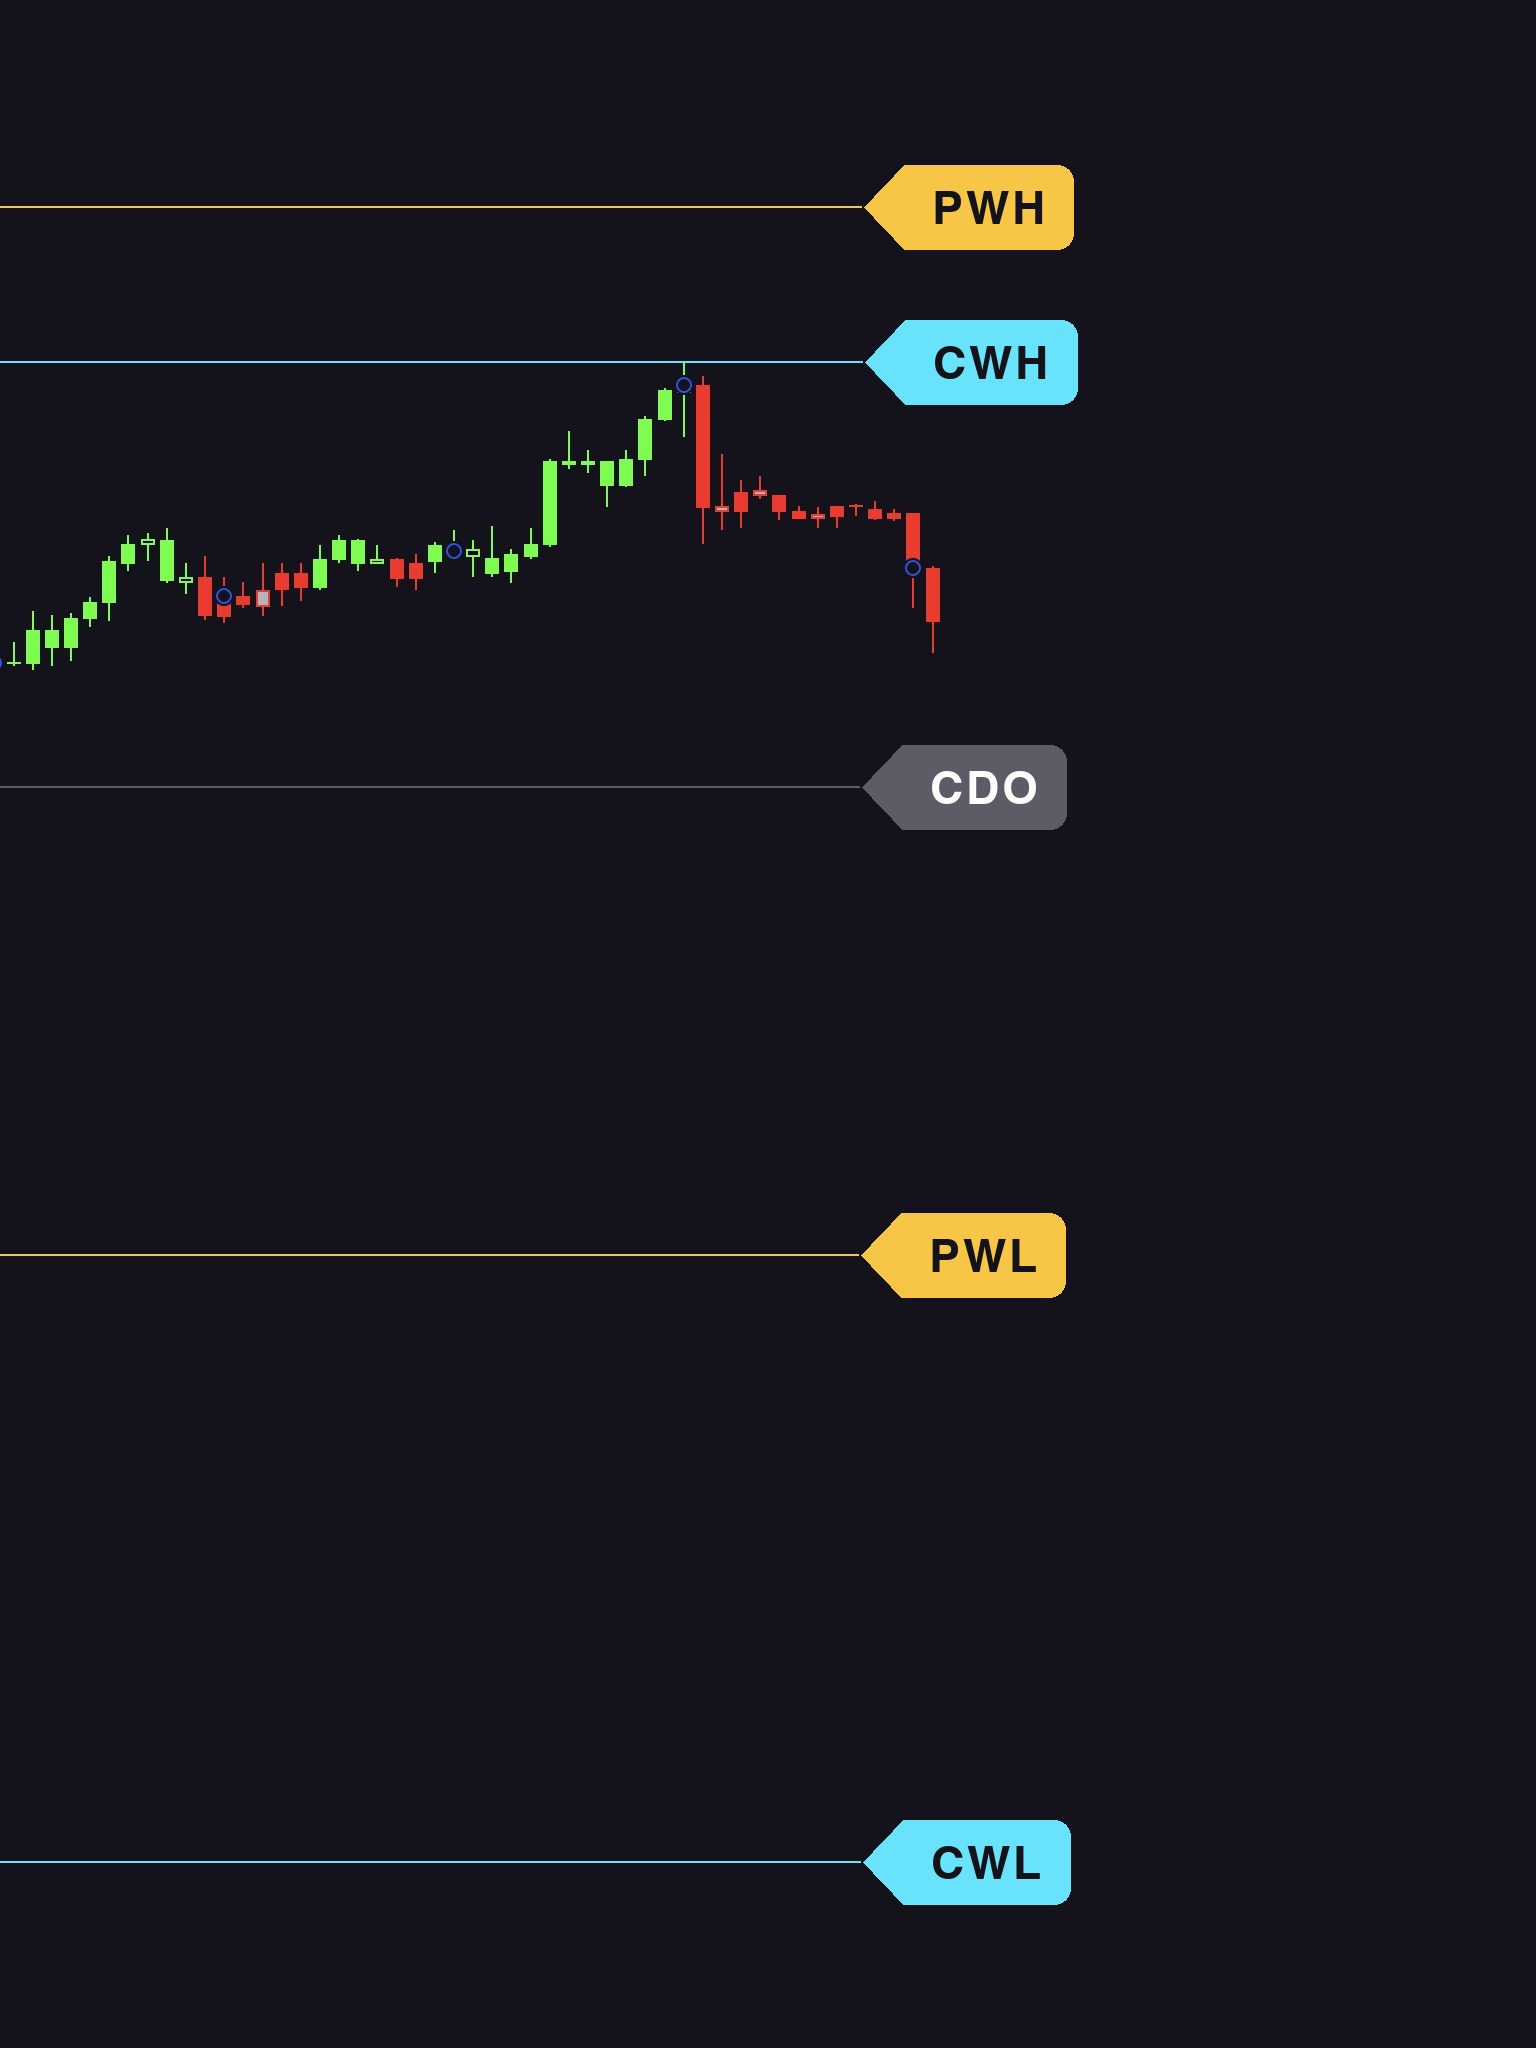
| Tag | Level | Default color | Behavior intraday |
|---|---|---|---|
| CWH / CWL | Current week high / low | Cyan | Developing boundaries; move outward when the current week prints a new extreme |
| PWH / PWL | Previous week high / low | Amber | Final extremes of the last completed week; fixed throughout the current week |
| CDO | Current day open | Translucent gray | Opening price of the current trading day; fixed until the next day begins |
Think of the five lines as three layers of context. PWH/PWL preserve the completed range of last week, CWH/CWL show the range the current week has built so far, and CDO anchors price to today's opening value. Every line carries a compact tag at the right edge, so the level remains identifiable even when several lines sit close together.