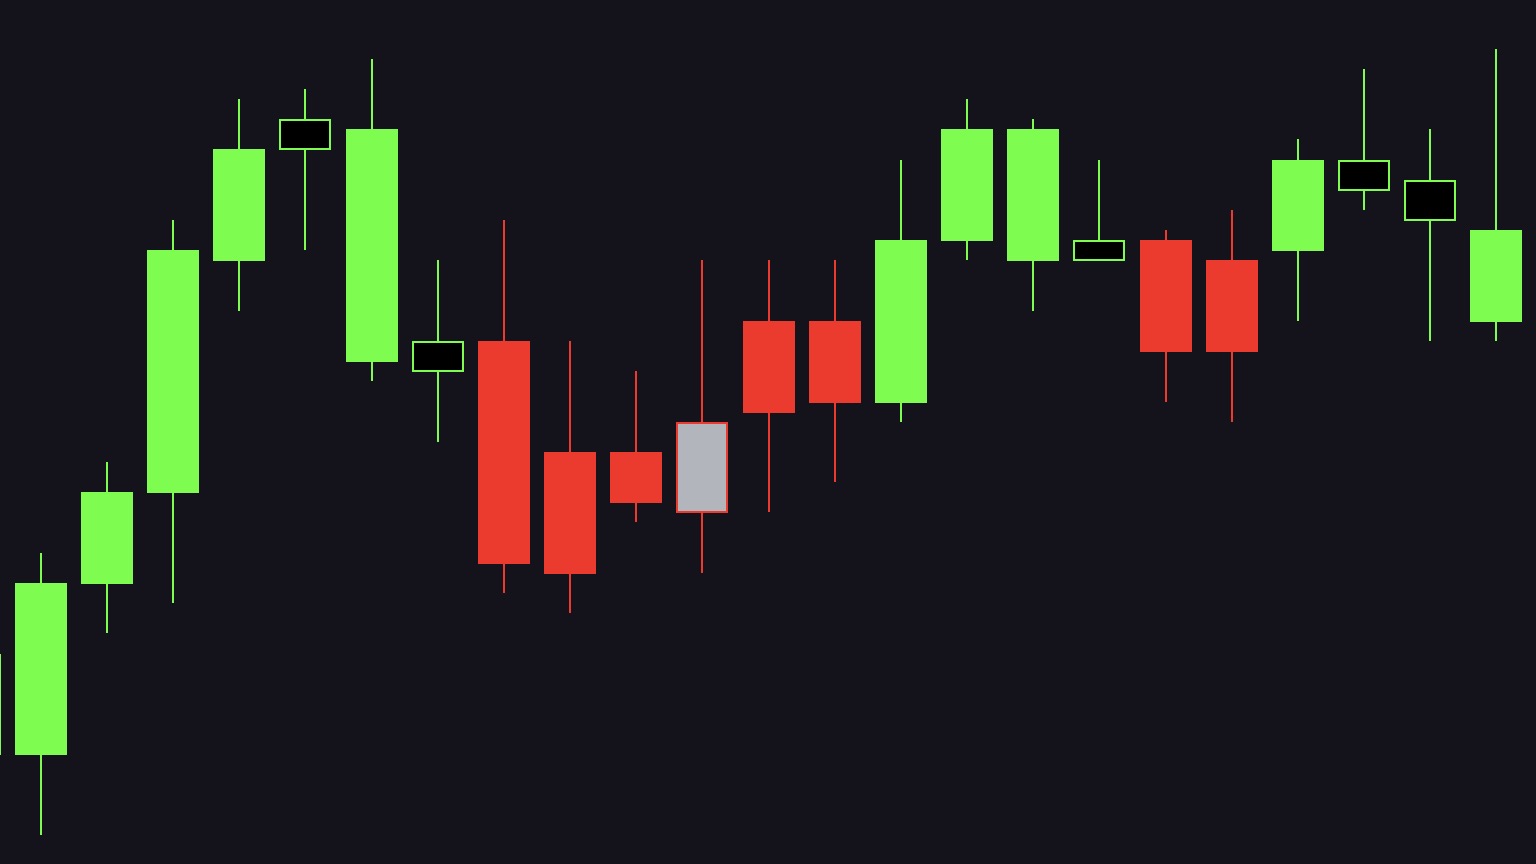
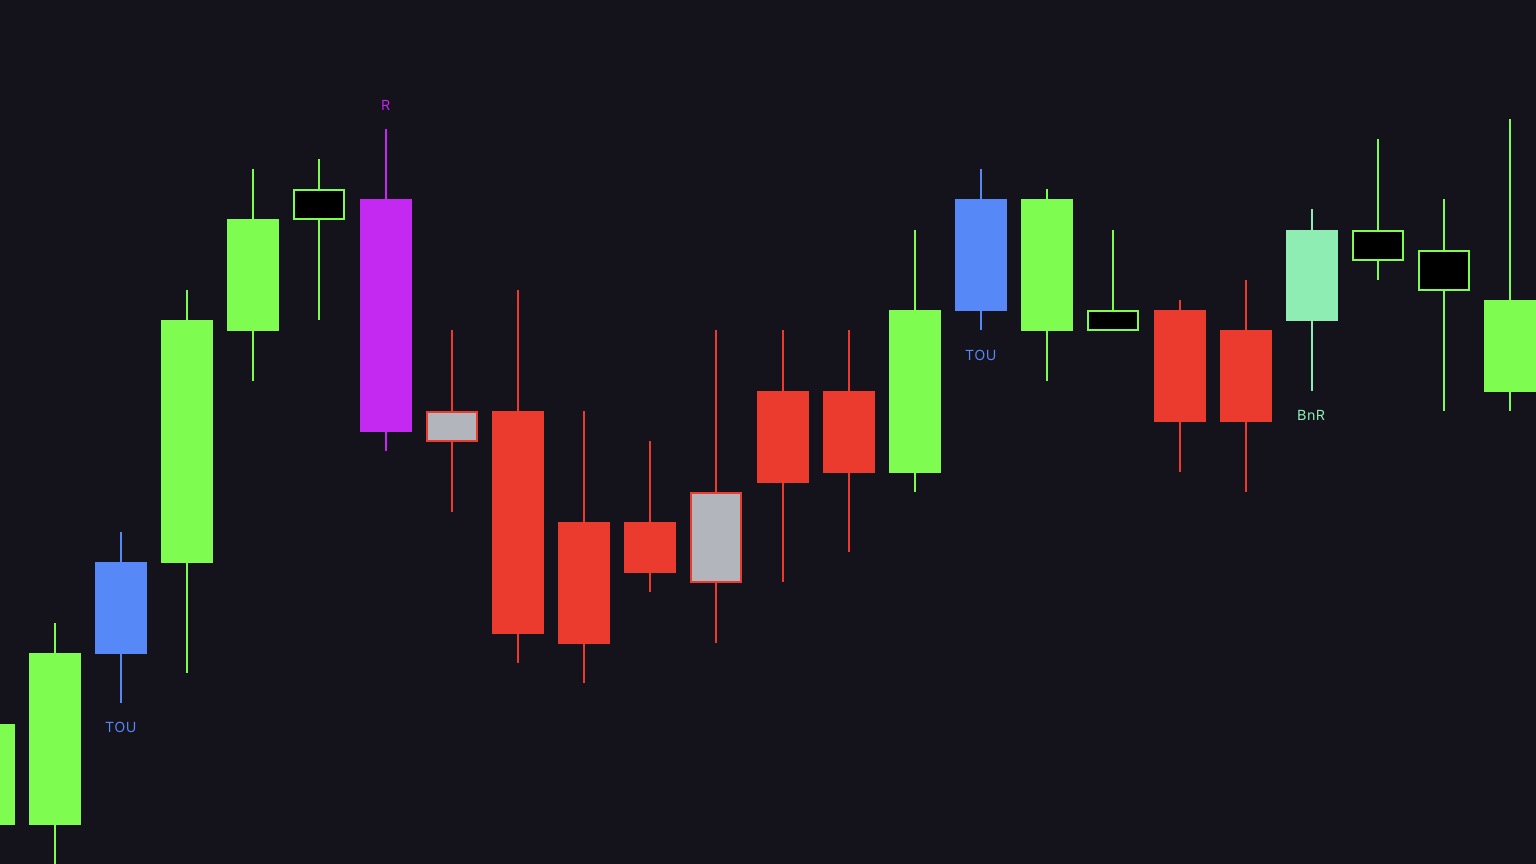
Every Artemis Pro pattern signal: what it means in order-flow terms, how detection differs from the textbook version, and how to read it in context.
Artemis Pro watches every bar for 10 candlestick patterns — two of them, the Three-Line Strike and the Hikkake, detected in both directions, giving 12 pattern signals in total. This page documents each signal: what it means in order-flow terms, how detection differs from the textbook version, and how to read it in context.
Current pattern set
Key Reversal (R), Kicker (K), and the visible Strong Breakout (BRK) signal have been removed; the underlying breakout test now acts only as an internal trend-flip rule. Hikkake (HK) remains. The new Three White Soldiers / Three Black Crows family adds the bullish 3WS and bearish 3BC signals. Any older screenshot that still shows R, K, or BRK predates the current signal engine.
How Signals Fire
Detection is not naive shape matching. Before any signal may fire, the bar has to pass a set of strict filters: body-size percentages, ATR-scaled magnitude checks, wick requirements, symmetry filters for star patterns, and trend context. A formation that merely resembles a pattern but lacks conviction is discarded silently.
When a signal does fire:
The candle is colored in the signal's signature color, overriding the trend color for that bar.
A compact text label prints next to the candle (below the low for bullish signals and above the high for bearish ones).
The label prints large when the pattern fires within 3 bars of a liquidity grab or level break, or on a bar that is a confirmed setup, and small when it fires on its own. Label size is your fastest read on whether a pattern happened at liquidity or in the middle of nowhere; it is not a check that every condition of a trade is met. See Liquidity Grabs.
Reversal patterns also force the trend engine to flip immediately, so the next candle already paints in the new direction. (Decisive momentum candles through the prior extreme do the same flip internally, without printing any signal.) See Trend Engine.
All patterns evaluate on bar close and do not repaint intrabar. Every signal state is also exposed as a 0/1 series in the Data Window — see .
Only a pattern that completes inside a fresh liquidity grab is escalated to a confirmed Setup Long/Short — every other label is context. Judging whether a marked pattern is tradable — trend, level, session, label size — stays your decision.
Quick Reference
Label
Pattern
Direction
Default color
MS
Morning Star
bullish
Cyan #00BCD4
ES
Evening Star
bearish
Orange #FF9100
TLS
Three-Line Strike
both
White (bull) / Pink #F50057 (bear)
HK
Hikkake
both
Yellow #FFFF00
3WS
Three White Soldiers
bullish
Electric blue #2962FF
3BC
Three Black Crows
bearish
Purple #D500F9
PL
Piercing Line
bullish
Emerald #00E676
TOD
Three Outside Down
bearish
Deep orange #FF6E40
TOU
Three Outside Up
bullish
Indigo #448AFF
BnR
Bump and Run Reversal Bottom
bullish
Mint #69F0AE
All colors are configurable in the settings, with one exception: the bullish Three-Line Strike always paints white and has no color input — see the Settings Reference.
Every signal except BnR also runs on the HTF mini-candles and feeds the signal row of the HTF info table. The HTF engine is a slightly reduced version: star patterns skip the symmetry filter, and Three White Soldiers / Three Black Crows drop the wick filter and ATR floor, using the direction of the candle before the sequence in place of the SSL trend context — so treat HTF labels as hints rather than full-quality signals.
MS — Morning Star
Direction: bullish. Color: cyan #00BCD4.
A three-candle bottom: a decisive bearish candle, a small middle candle with a pronounced lower rejection wick, then a bullish candle that closes deep back into the first candle's body.
Order flow. Sellers press (candle one), momentum dies and the low gets rejected (candle two), buyers take control and reclaim most of the lost ground (candle three). It is exhaustion, indecision, confirmation — in that order.
How Artemis Pro is stricter. Three detection modes run in parallel, joined by OR:
Strict demands decisive bodies on the outer candles and a deep close back into the first candle.
Relaxed requires the middle candle to make a new low with a clearly shrinking body, then a third candle that closes above the middle candle entirely.
Classic accepts a small-bodied, indecisive middle candle in the traditional star position.
On top of that, strict and relaxed detections must pass a body-symmetry filter: the first and third candle bodies may not differ by more than the configured asymmetry (default 0.30), unless the third candle is at least as large as the first — a power move earns an exemption. Lopsided formations where a huge sell candle is "answered" by a timid bounce do not print. In all modes the middle candle needs a meaningful lower rejection wick; a star without rejection is just a pause.
Reading it. MS after an extended decline into support or a swept low is the textbook context. Check the third candle: the more of candle one it reclaims, the cleaner the read. A large label at a liquidity grab is the high-quality variant.
ES — Evening Star
Direction: bearish. Color: orange #FF9100.
The exact mirror of the Morning Star at a top: a decisive bullish candle, a small middle candle with an upper rejection wick, then a bearish candle closing deep back into the first candle's body.
Everything written about MS applies in reverse — the same three detection modes, the same symmetry filter, and the same requirement for real rejection on the middle candle. Look for it after an extended push into resistance, a swept high, or an HTF level, and let the label size tell you whether liquidity was involved.
TLS — Three-Line Strike
Direction: both. Colors: the bearish strike paints pink #F50057; the bullish strike paints white so it stays legible against the trend colors.
Three consecutive candles pushing one way with progressively new extremes, then a single counter-candle that engulfs all three — closing beyond the open of the first candle in the sequence.
Order flow. One candle erases three candles of work. Every participant who entered during the three-candle push is now underwater at the close, and a large share of them will exit into the new direction. It is the most visually violent single-bar shift the engine tracks.
How Artemis Pro is stricter. The three setup candles must be genuinely directional — three bearish candles with falling lows (for the bullish strike) or three bullish candles with rising highs (for the bearish strike) — and the strike candle must close beyond the open of the first of the three. Three sideways candles followed by a big bar do not qualify.
Reading it. TLS often is the liquidity grab: the third push commonly sweeps a level before the strike candle reverses it. When the label prints large, the strike fired at liquidity — a grab or break within the last 3 bars, or a confirmed setup on that bar. That is context to check, not a complete entry on its own. TLS forces the trend flip, so expect the following candles to paint in the strike's direction.
HK — Hikkake
Direction: both. Color: yellow #FFFF00.
An inside bar followed by a fake breakout: price breaks one side of the mother bar's range, then closes beyond the opposite side.
Order flow. This is the codified stop-run. The inside bar is a coil — both sides waiting. The break from the coil pulls in breakout traders; when the bar closes through the other side of the mother bar, those traders are trapped, and their exits fuel the move in your direction.
How Artemis Pro is stricter. The signal requires a genuine inside bar (fully contained within the bar before it), a real violation of the mother bar's extreme on one side, and a close beyond the mother bar's opposite extreme — not merely back inside the range. A poke that closes mid-range is not a Hikkake here. That close-through requirement is stricter than every published variant of the pattern.
Reading it. The honest statistics first: naked, the hikkake is a coin flip. Bulkowski tested it on roughly 20,000 samples and measured 52 percent bullish and 50 percent bearish continuation, with performance ranks of 83–84 of 105. The pattern's inventor reported his own tests running at about 1:1 win/loss — but with a fat right tail: in his COMEX gold data, roughly 29 percent of confirmed signals ran beyond three times the initial risk. An independent test across 42 futures markets and 34 years landed at a profit factor of about 1.05 standalone. So why does it ship while other weak signals were cut? A 2026 study of roughly 200 million hourly candles across some 400 instruments, with data-snooping controls, found the hikkake to be one of only two candlestick patterns with a robust positive intraday edge. Read it the way the method teaches: naked, it is a coin flip — at a level where breakout stops actually cluster, it is a map of trapped traders, and it comes with built-in stop placement beyond the pattern extreme. Yellow candles mark spots where the obvious trade just failed; the direction of the HK signal is the direction of the close, against the fake break, and the label size tells you whether liquidity was involved.
3WS — Three White Soldiers
Direction: bullish. Color: electric blue #2962FF. The "3WS" label prints below the low.
Three consecutive decisive bullish candles, each closing above the previous close, each opening inside the previous candle's body, with only small upper wicks — a staircase of sustained buying after a decline.
Order flow. One strong candle can be a short squeeze; three in a row are a different statement. Each candle opens inside the prior body — a small concession to sellers — and buyers immediately drive it to a new closing high, leaving almost nothing behind at the top. Sellers get three consecutive chances to cap the move and fail all three times. That is sustained initiative buying, not a single burst.
How Artemis Pro is stricter. The textbook version accepts any three rising white candles. Artemis Pro requires all of the following: each body at least 50 percent of its range; each close above the prior close; upper wicks of no more than 25 percent on all three candles; each open inside the prior candle's body (inclusive — on gapless intraday charts, where each open equals the prior close, the open sits exactly on the boundary and still passes); a total advance of at least 1.0 ATR across the sequence; and trend context — the pattern only fires when the trend before the three-candle sequence was bearish. Three green candles inside an existing uptrend are continuation, not a reversal, so they are suppressed. (On HTF mini-candles a reduced variant runs: body and progressive-close checks only, with the direction of the candle before the sequence standing in for trend context — no wick filter, no ATR floor.)
Reading it. In Thomas Bulkowski's statistics (thepatternsite.com, measured on daily S&P stock data — not intraday futures), Three White Soldiers acts as a bullish reversal 82 percent of the time, with a frequency rank of 67 and an overall performance rank of 32 of 103, across roughly 3,333 samples. His caveat matters as much as the headline number: follow-through after upward breakouts is weak — his word is "lousy" — and in a downtrend the pattern often turns out to be nothing more than a retracement. That is exactly why the trend-context filter exists and why the rule of only taking patterns at levels applies with extra force here. Note also that the signal prints on the third candle, so a meaningful part of the move is already behind you — read 3WS as a trend-change flag, not a fresh entry by itself. One structural point in its favor: soldiers are gap-free by definition, so they can form even on markets that trade nearly around the clock, where gap-dependent patterns structurally cannot.
3BC — Three Black Crows
Direction: bearish. Color: purple #D500F9. The "3BC" label prints above the high.
The exact mirror of the soldiers at a top: three consecutive decisive bearish candles, each closing below the previous close, each opening inside the previous candle's body, with only small lower wicks.
Order flow. Buyers lift each open back into the prior body and are sold into three times in a row, with each candle closing at a new low and barely any rejection at the bottom. Distribution across three bars is far harder to fake than one large red candle — someone is consistently unloading into every bounce.
How Artemis Pro is stricter. The same gates as 3WS, mirrored: each body at least 50 percent of its range; each close below the prior close; lower wicks of no more than 25 percent on all three candles; each open inside the prior candle's body (inclusive, so gapless intraday charts pass); a total decline of at least 1.0 ATR across the sequence; and trend context — crows only fire when the trend before the sequence was bullish. (The HTF mini-candle variant is reduced in the same way as 3WS.)
Reading it. In Bulkowski's statistics (thepatternsite.com, daily S&P stock data), Three Black Crows acts as a bearish reversal 78 percent of the time, with a frequency rank of 60 — and an overall performance rank of 3 of 103, one of the best follow-through ranks in his entire catalog. The honest footnote: that measurement rests on 2,660 samples, below the 20,000 he prefers before trusting a statistic, so treat the rank as promising rather than proven. Like the soldiers, crows print on the third candle and are gap-free by definition, which makes them one of the few bearish reversal patterns that can actually form on markets that trade nearly around the clock.
PL — Piercing Line
Direction: bullish. Color: emerald #00E676.
A decisive bearish candle, then a bullish candle that opens below the prior close and closes above the midpoint of the prior body — but not above the prior open. A close above the prior open would make it an engulfing candle; the piercing line is specifically the partial reclaim.
Order flow. The market opens below the previous close — sellers in control — and buyers absorb the follow-through and drive price back through more than half of the previous candle's losses. The gap-down open failing is the tell: supply was offered and eaten.
How Artemis Pro is stricter. Both candles must have decisive bodies; a doji "piercing" a small red candle is not a signal. The open must be strictly below the prior close — an open exactly at the prior close does not count, gapless chart or not — and the close must clear the true midpoint of the prior body.
Reading it. PL is a bullish-only signal and sits at the bottom of the pattern priority chain, so when it prints, it prints alone. It reads best as a dip-buy confirmation inside a broader bullish context — at support, at a swept low, or after a pullback in an uptrend.
TOD / TOU — Three Outside Down / Up
Direction: TOD bearish, TOU bullish. Colors: deep orange #FF6E40 (TOD), indigo #448AFF (TOU).
A three-candle engulfing sequence. For TOD: a bullish candle, then a strong bearish engulfing candle, then a bearish confirmation candle closing beyond the engulfing close. TOU is the exact mirror.
Order flow. The direction candle draws participants in, the engulfing candle overwhelms them, and the confirmation candle proves the engulfing was initiative rather than a one-bar shakeout. The confirmation requirement is what separates this from a plain engulfing pattern — you are seeing follow-through, not just a big bar.
How Artemis Pro is stricter. The engulfing candle must have a body of at least 50 percent of its range, a body strictly greater than 1.5 times the prior candle's body (exactly 1.5 times does not pass), and a body of at least 0.5 ATR, with the ATR taken on the confirmation bar — three independent size gates. The confirmation candle needs a body of at least 40 percent and must close beyond the engulfing candle's close. Weak engulfings and hesitant confirmations are filtered out; these thresholds are why TOD and TOU fire far less often than generic engulfing scanners.
Reading it. Because the signal prints on the confirmation candle, you are one bar later than a raw engulfing — that is the price of the filter. The engulfing candle in the sequence frequently performs the liquidity grab; a large label tells you a grab or break was recent, which is worth checking on the chart before you treat it as one.
BnR — Bump And Run Reversal Bottom
Direction: bullish only. Color: mint #69F0AE.
Based on Thomas Bulkowski's Bump-and-Run Reversal research. A gradual decline (the lead-in) suddenly accelerates into a much steeper drop (the bump), and then a strong bullish candle closes back above the previous candle's high (the run).
Order flow. The acceleration phase is capitulation — the decline steepening to a multiple of its earlier pace means late sellers are being flushed out at the worst prices. When a decisive bull candle immediately reclaims the prior high, the flush is over and the market has run out of sellers at these levels.
How Artemis Pro is stricter. This is a fixed-window rule on the chart timeframe, not a fitted multi-week trendline: the engine measures the actual rate of decline across the lead-in window and requires the bump phase to be a clear multiple of the lead-in's pace, with an ATR-scaled minimum depth, before a run candle with a decisive body and a close above the prior high can trigger the signal. Ordinary pullbacks that simply drift lower never qualify — the acceleration is mandatory.
Reading it. BnR is deliberately rare. It marks capitulation lows, so it appears at exactly the moments that feel like the worst times to buy. It is the one signal that does not exist on the HTF mini-candles — the multi-bar lead-in measurement runs on the chart timeframe only.
Priority: One Signal Per Bar
Multiple conditions can be true on the same bar, but only the highest-priority signal colors the candle and prints its label. The chain, highest first:
BnR > TLS > 3WS/3BC > HK > TOU/TOD > MS/ES > PL
BnR is bullish-only, so on the bearish side the chain starts at TLS. The HTF mini-candles run the same chain without BnR. The plain trend color ranks below every pattern: any bar with no signal at all simply wears its trend color. (Decisive momentum candles that flip the trend internally have no place in this chain — they paint no special color and print no label.)
The ordering is by information value. A Bump and Run marks a capitulation low and a Three-Line Strike is a rarer, more violent repricing than a Piercing Line, so when several descriptions fit the same bar, you see the strongest claim. The Data Window is not filtered this way — every signal's 0/1 series reports independently, so lower-priority patterns masked on the chart are still visible there for backtesting.