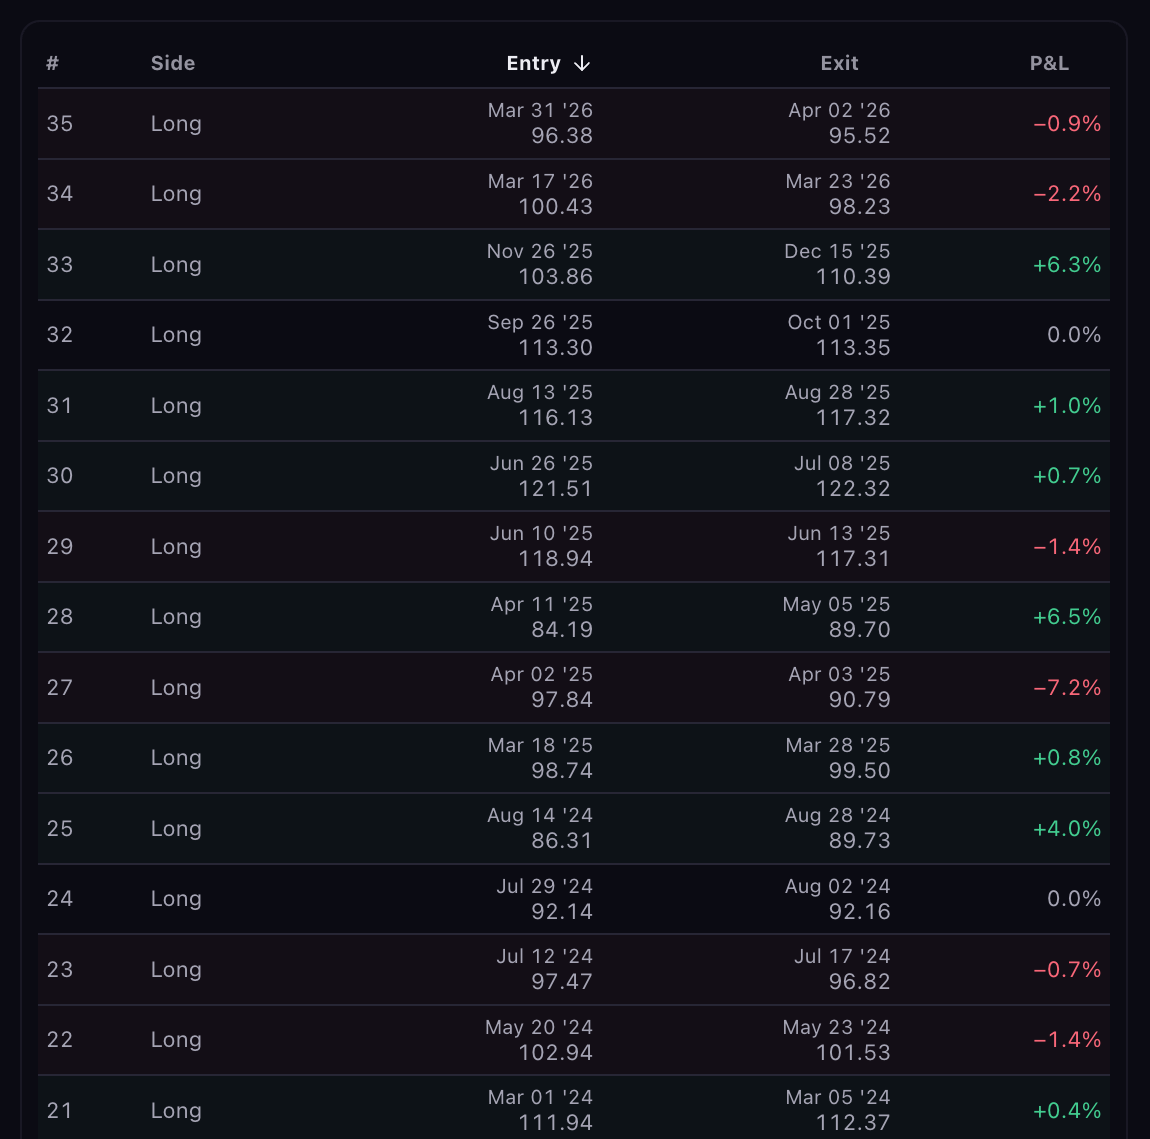
Trade Analysis
The Trade Analysis tab: the R distribution, the win rate ring, every trade in the log, and the notes.
The Performance tab tells you how much a strategy made. Trade Analysis tells you how: what its trades looked like, how many won, which ones did the work, and whether a good headline came from many steady trades or a couple of lucky ones.
Everything on this tab describes the whole run. It does not follow the window presets on the Performance tab.
R Distribution
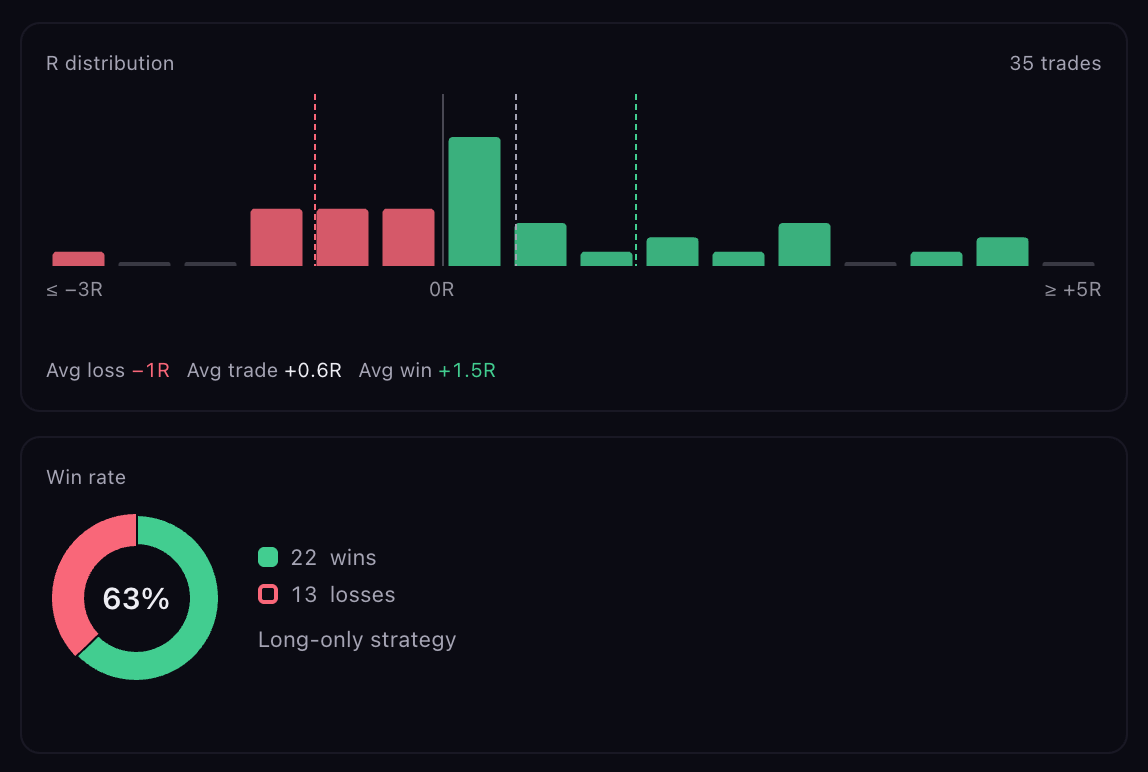
The histogram sorts every closed trade by its result measured in R: the trade's profit or loss divided by the strategy's typical risk per trade, the average distance from entry to the protective stop. A trade at +2R made twice what a typical trade risked; a trade at −1R lost exactly its risk. Measuring in R lets you compare trades of different sizes on one scale.
Bars run from −3R to +5R in half-R steps. Anything beyond the ends is folded into the end bars, so nothing is hidden. Hover or tap a bar to see its range and how many trades landed there.
Three dashed lines mark Avg loss, Avg trade and Avg win, with their values printed beneath. Each line is drawn only where the run holds a trade of that kind. This is the quickest read on whether the average winner outweighs the average loser: a strategy that wins a quarter of the time can still come out ahead if its winners are four times its losers.
If risk per trade could not be measured for a run, the histogram is replaced by a sentence saying so. The trade log still lists every trade's own result.
Win Rate
The ring splits closed trades into wins and losses, and breakeven when there were any. The number in the middle is the run's win rate. Hover an arc for its count and share. A long-only strategy says so beneath the legend.
Because the ring covers the whole run, it can differ from the Win rate tile on the Performance tab once a preset narrows that tab. A breakeven trade counts in the total and in neither share, so wins plus losses need not reach the trade count.
The Trade Log
Above the log sits a copy of the equity curve, always the full run. It stays in view while you scroll the list, and selecting a trade highlights its stretch on the curve.
The log lists every trade, 100 to a page, newest first.