ChartMystic
  • How it works
  • Products
  • Live demo
  • Results
  • Pricing
  • Docs
Log inSign up
  • How it works
  • Products
  • Live demo
  • Results
  • Pricing
  • Docs
  • Log in

Documentation

Artemis Pro

InstallationOverviewHow Artemis Pro ThinksReading The ChartTrend EngineSignal ReferenceLiquidity LinesLiquidity GrabsSession BoxesHTF LevelsHTF CandlesHTF Info TableBacktesting And Data WindowSupported Markets And ChartsSettings ReferenceFAQGlossary

Scribe Studio

OverviewAsk for a StrategyPerformanceTrade AnalysisCodeTweaking Your StrategyTransfer to TradingViewThe Strategy LibraryHistory & Saved StrategiesFAQGlossary
ChartMystic
Documentation/Artemis Pro/HTF Info Table

HTF Info Table

The on-chart dashboard: one column per enabled higher timeframe, four rows of live state, and a footer with the indicator version.

The HTF info table is the on-chart dashboard: one column per enabled higher timeframe, four rows of live state, and a footer with the indicator version. This page explains how to read each row, how the countdown behaves, and where to configure the table.
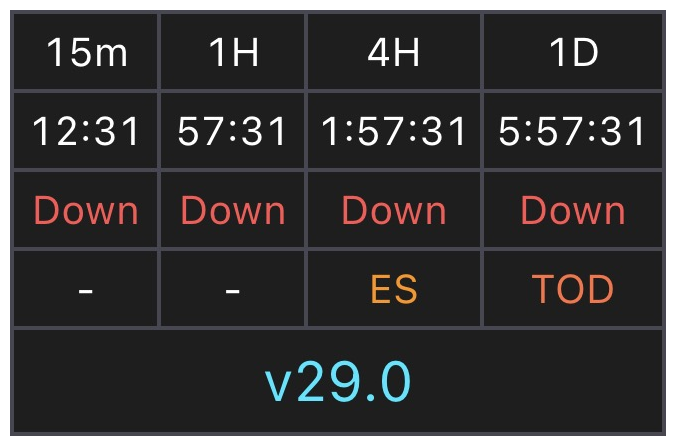
Artemis Pro HTF info table with four enabled timeframes, live countdowns, candle directions, pattern signals, and a version footer
Visual referenceHTF info table

One column per enabled timeframe: a live countdown to candle close, the candle direction, and the active signal — plus the indicator version in the footer row.

Reading The Table

Each column belongs to one of the four HTF slots configured in HTF Candles; a slot must be enabled there to get a column. Every column shows the same four rows:

RowContent
TimeframeThe slot's timeframe in compact form, e.g. 15m, 1H, 4H, 1D
PreviousHTF CandlesNextBacktesting And Data Window

Need help?

CountdownTime remaining until that timeframe's current candle closes, as mm:ss (or h:mm:ss above one hour)
DirectionUp or Down for the current, still-forming candle — green for Up, red for Down
SignalThe active pattern label from the HTF engine, printed in the pattern's color, or a dash when no pattern is active

In the example above, all four current HTF candles point Down. The 15m and 1H columns show no active pattern (-), while the 4H column shows an Evening Star (ES) and the 1D column shows a Three Outside Down (TOD).

The signal row shows the same label the newest mini-candle of that slot carries (PL, MS, ES, TOD, TOU, HK, 3WS, 3BC, TLS). It comes from the same reduced HTF engine, so the caveats from the HTF Candles page apply: treat it as a hint, not a full-quality signal. Direction and signal describe a candle that has not closed yet — patterns only become final on candle close.

A common use of the countdown

When a pattern is showing on the 1H with two minutes left in the candle, wait those two minutes. If the pattern survives the close, it is confirmed; if the candle keeps moving, the label can still change.

Countdown Behavior

The countdown works in both live trading and TradingView's bar replay. Live, it ticks down against the wall clock. In replay, Artemis Pro detects that the chart is running on historical time and measures the remaining time from the replay bar instead, so the countdown stays meaningful while you step through history.

Version Footer

The footer row shows the indicator version. The script title on the chart is simply "Artemis Pro" with no version number, so this footer is the only place on the chart where the version appears. Check it before reporting an issue — support will ask for it. See the FAQ.

Settings

The table is configured in settings group 9. HTF Info Table.

InputDefaultEffect
Show HTF Info Table?onMaster toggle
Table Positiontop rightOne of six anchor points: top or bottom, combined with left, center, or right
Backgrounddark grayCell background color
Text ColorwhiteDefault text color (direction and signal cells keep their own colors)

Which columns appear is not set here — enable or disable slots in group 8. HTF Candles, and the table follows.