Atlas Pro Oscillator
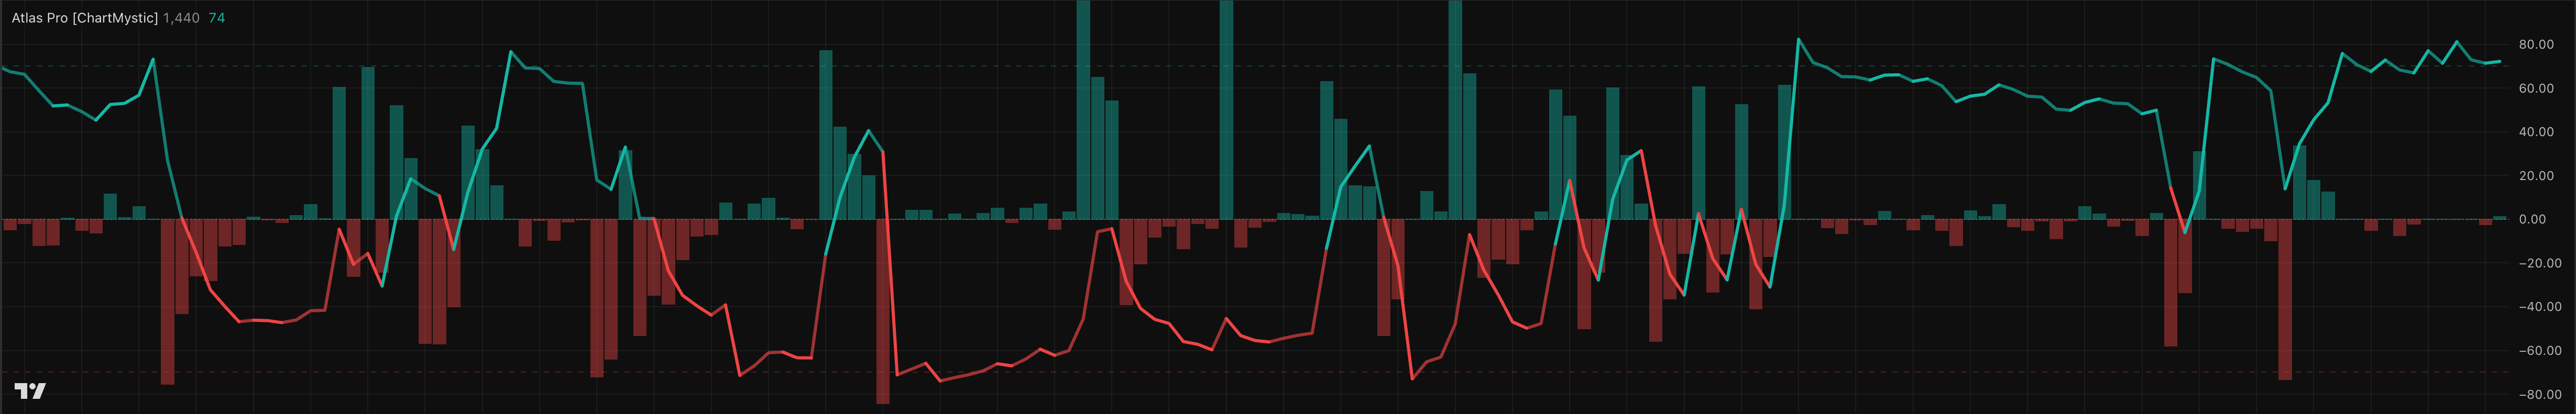
How the oscillator line and buildup histogram show directional pressure developing over time.
The Atlas Pro Oscillator is the pressure view. The main chart shows the current read and confirmed markers. The dashboard explains the active read in text. The oscillator shows how that read is developing through time.
A chart marker is a discrete event. The dashboard is a snapshot. The oscillator is closer to a pressure gauge — it shows whether the current read is strengthening, fading, stabilizing, or trying to flip before that change becomes obvious from a single marker.
Read the oscillator as context
The oscillator is not a second signal system. Use it to understand pressure and buildup, then confirm against the main chart, dashboard, Key Zone, and confirmed markers.
The Atlas Pro Oscillator is a pressure pane that renders below the main chart and shows whether the current read is strengthening, fading, or rotating.
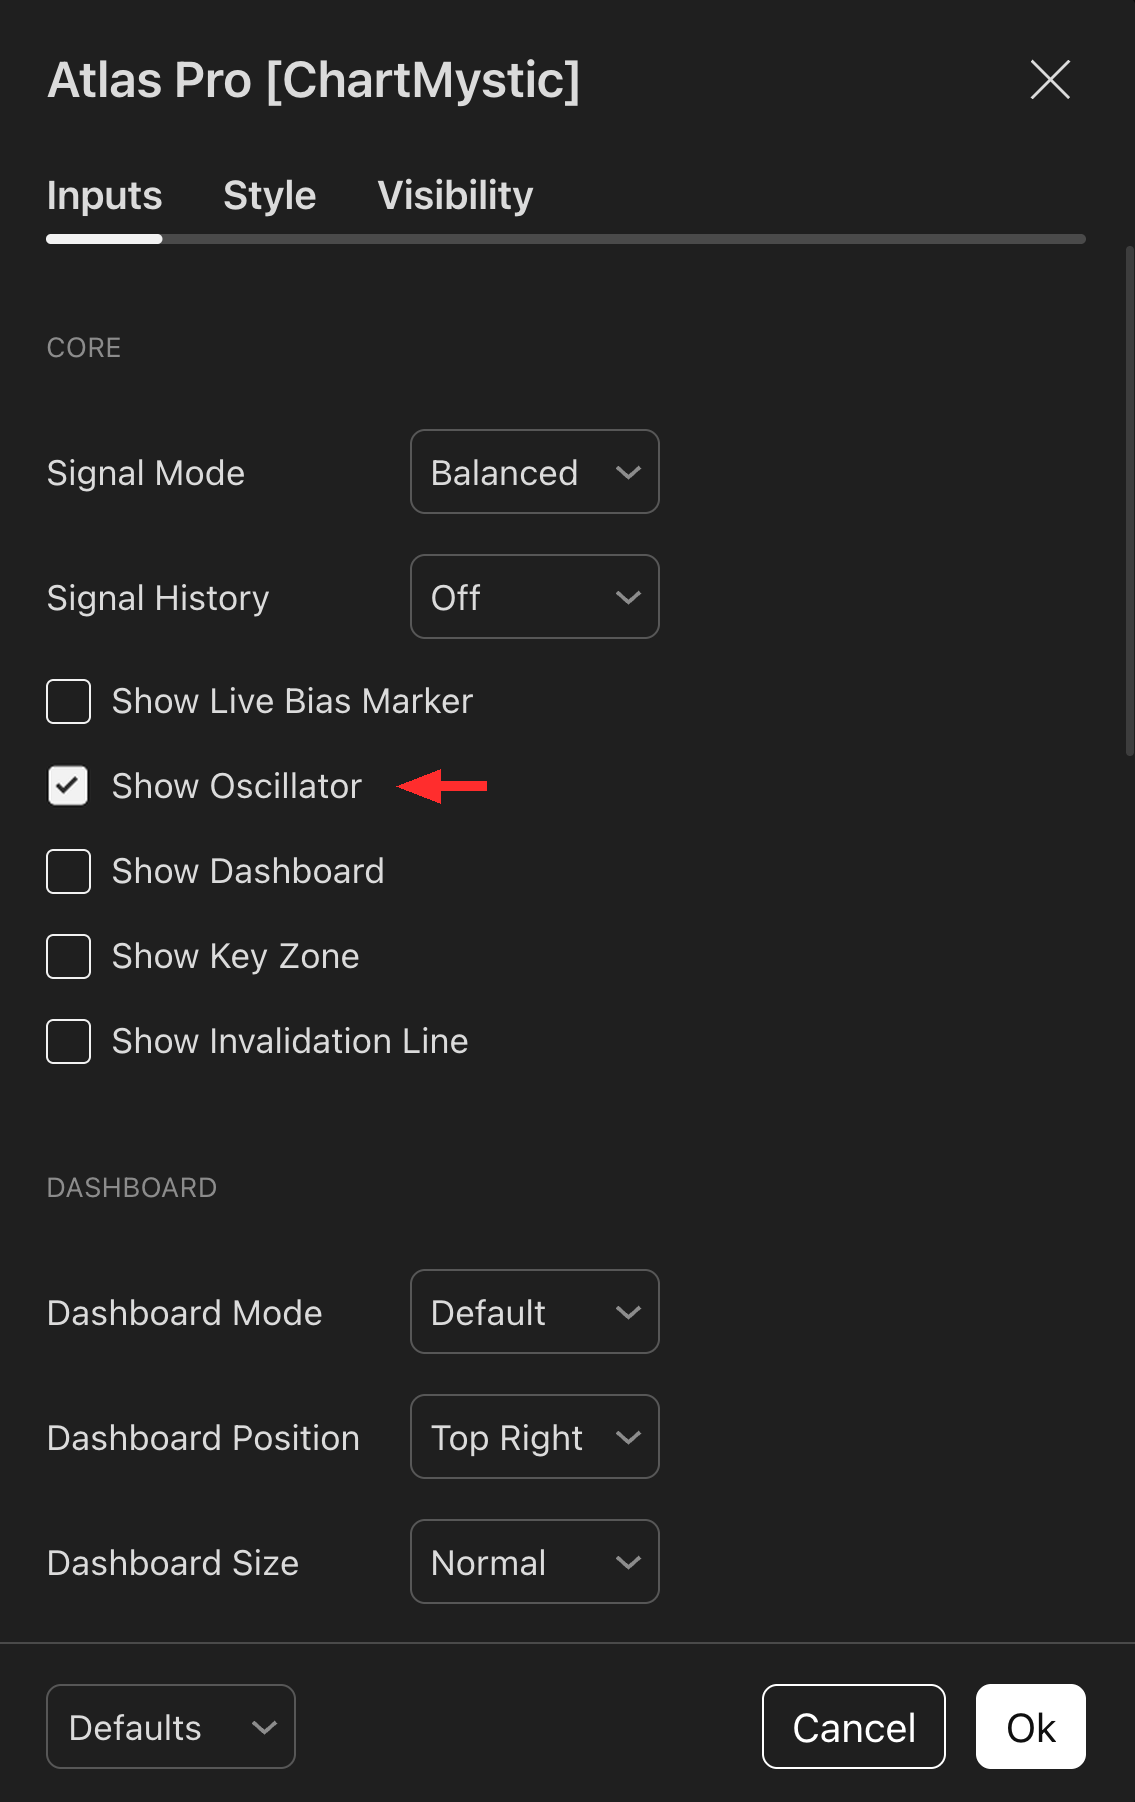
Enable Show Oscillator under the Core section of the Atlas Pro settings to add the pane to your TradingView layout.
The Oscillator Line
The oscillator line converts the current directional read and confidence into a signed pane value on a −100 to +100 scale.
- Positive values show bullish directional pressure.
- Negative values show bearish directional pressure.
- The zero line is the neutral balance point.
- Guide levels near +70 and −70 mark where pressure becomes decisive.
The line is smoothed so it does not whip around on every tick. When a confirmed signal is present, the oscillator can anchor more firmly to the confirmed side. When a weak flip attempt appears without supporting evidence, the line softens toward neutral rather than snapping to the opposite side.
The Buildup Histogram
The buildup bars show the difference between the live pressure read and the displayed oscillator line. In plain language, the bars show pressure building ahead of the smoother line.
Positive buildup bars mean live pressure is pushing above the current displayed state. Negative buildup bars mean live pressure is pushing below it. This helps you see a thesis developing before a confirmed signal appears, or pressure cooling after a strong move.
The bars are not an independent buy or sell signal. They are a way to see the engine's internal pressure changing over time.
How To Read It
Direction
Is the line above zero, below zero, or working through neutral? This is the coarse read — the side currently winning the pressure contest.
Slope
Is pressure strengthening, fading, or flattening? Slope tells you whether the current side is still gaining ground or running out of fuel.
Buildup
Are the bars pushing in the same direction as the line, or against it? Same-direction buildup confirms; opposing buildup warns of cooling pressure.
Divergence
Does the oscillator show weakening pressure while price still looks extended? That gap is often the earliest visible sign of a stall.
The oscillator is most useful read alongside the Live Bias Marker, Dashboard, Key Zone, and confirmed markers. It does not replace those pieces — it makes the pressure curve underneath them easier to see.
Example Reads
A rising line above zero with positive buildup bars: bullish pressure that is still building.
A line above zero with buildup bars turning negative: bullish pressure cooling even though the current read has not flipped.
A line near zero with bars alternating sides: a mixed-state chart. Wait for the dashboard and confirmed markers to clarify.
A line moving from one side toward zero but not cleanly crossing: pressure fading without enough evidence for a full directional flip.
Common mistakes
- Do not treat every oscillator turn as a signal.
- Do not read the oscillator without checking the main chart.
- Do not assume an oscillator level guarantees continuation or reversal.
The oscillator is context. The confirmed marker and the broader Atlas Pro read matter more than any single pane movement.