Dashboard
Every dashboard row explained, from confidence and acceptance to overlays, recent signals, MTF rows, and footprint status.
The Atlas Pro Dashboard is the cockpit. It does not replace the chart and it does not create a separate signal — it gathers the engine's most useful context into one small panel so you can read the current state at a glance.
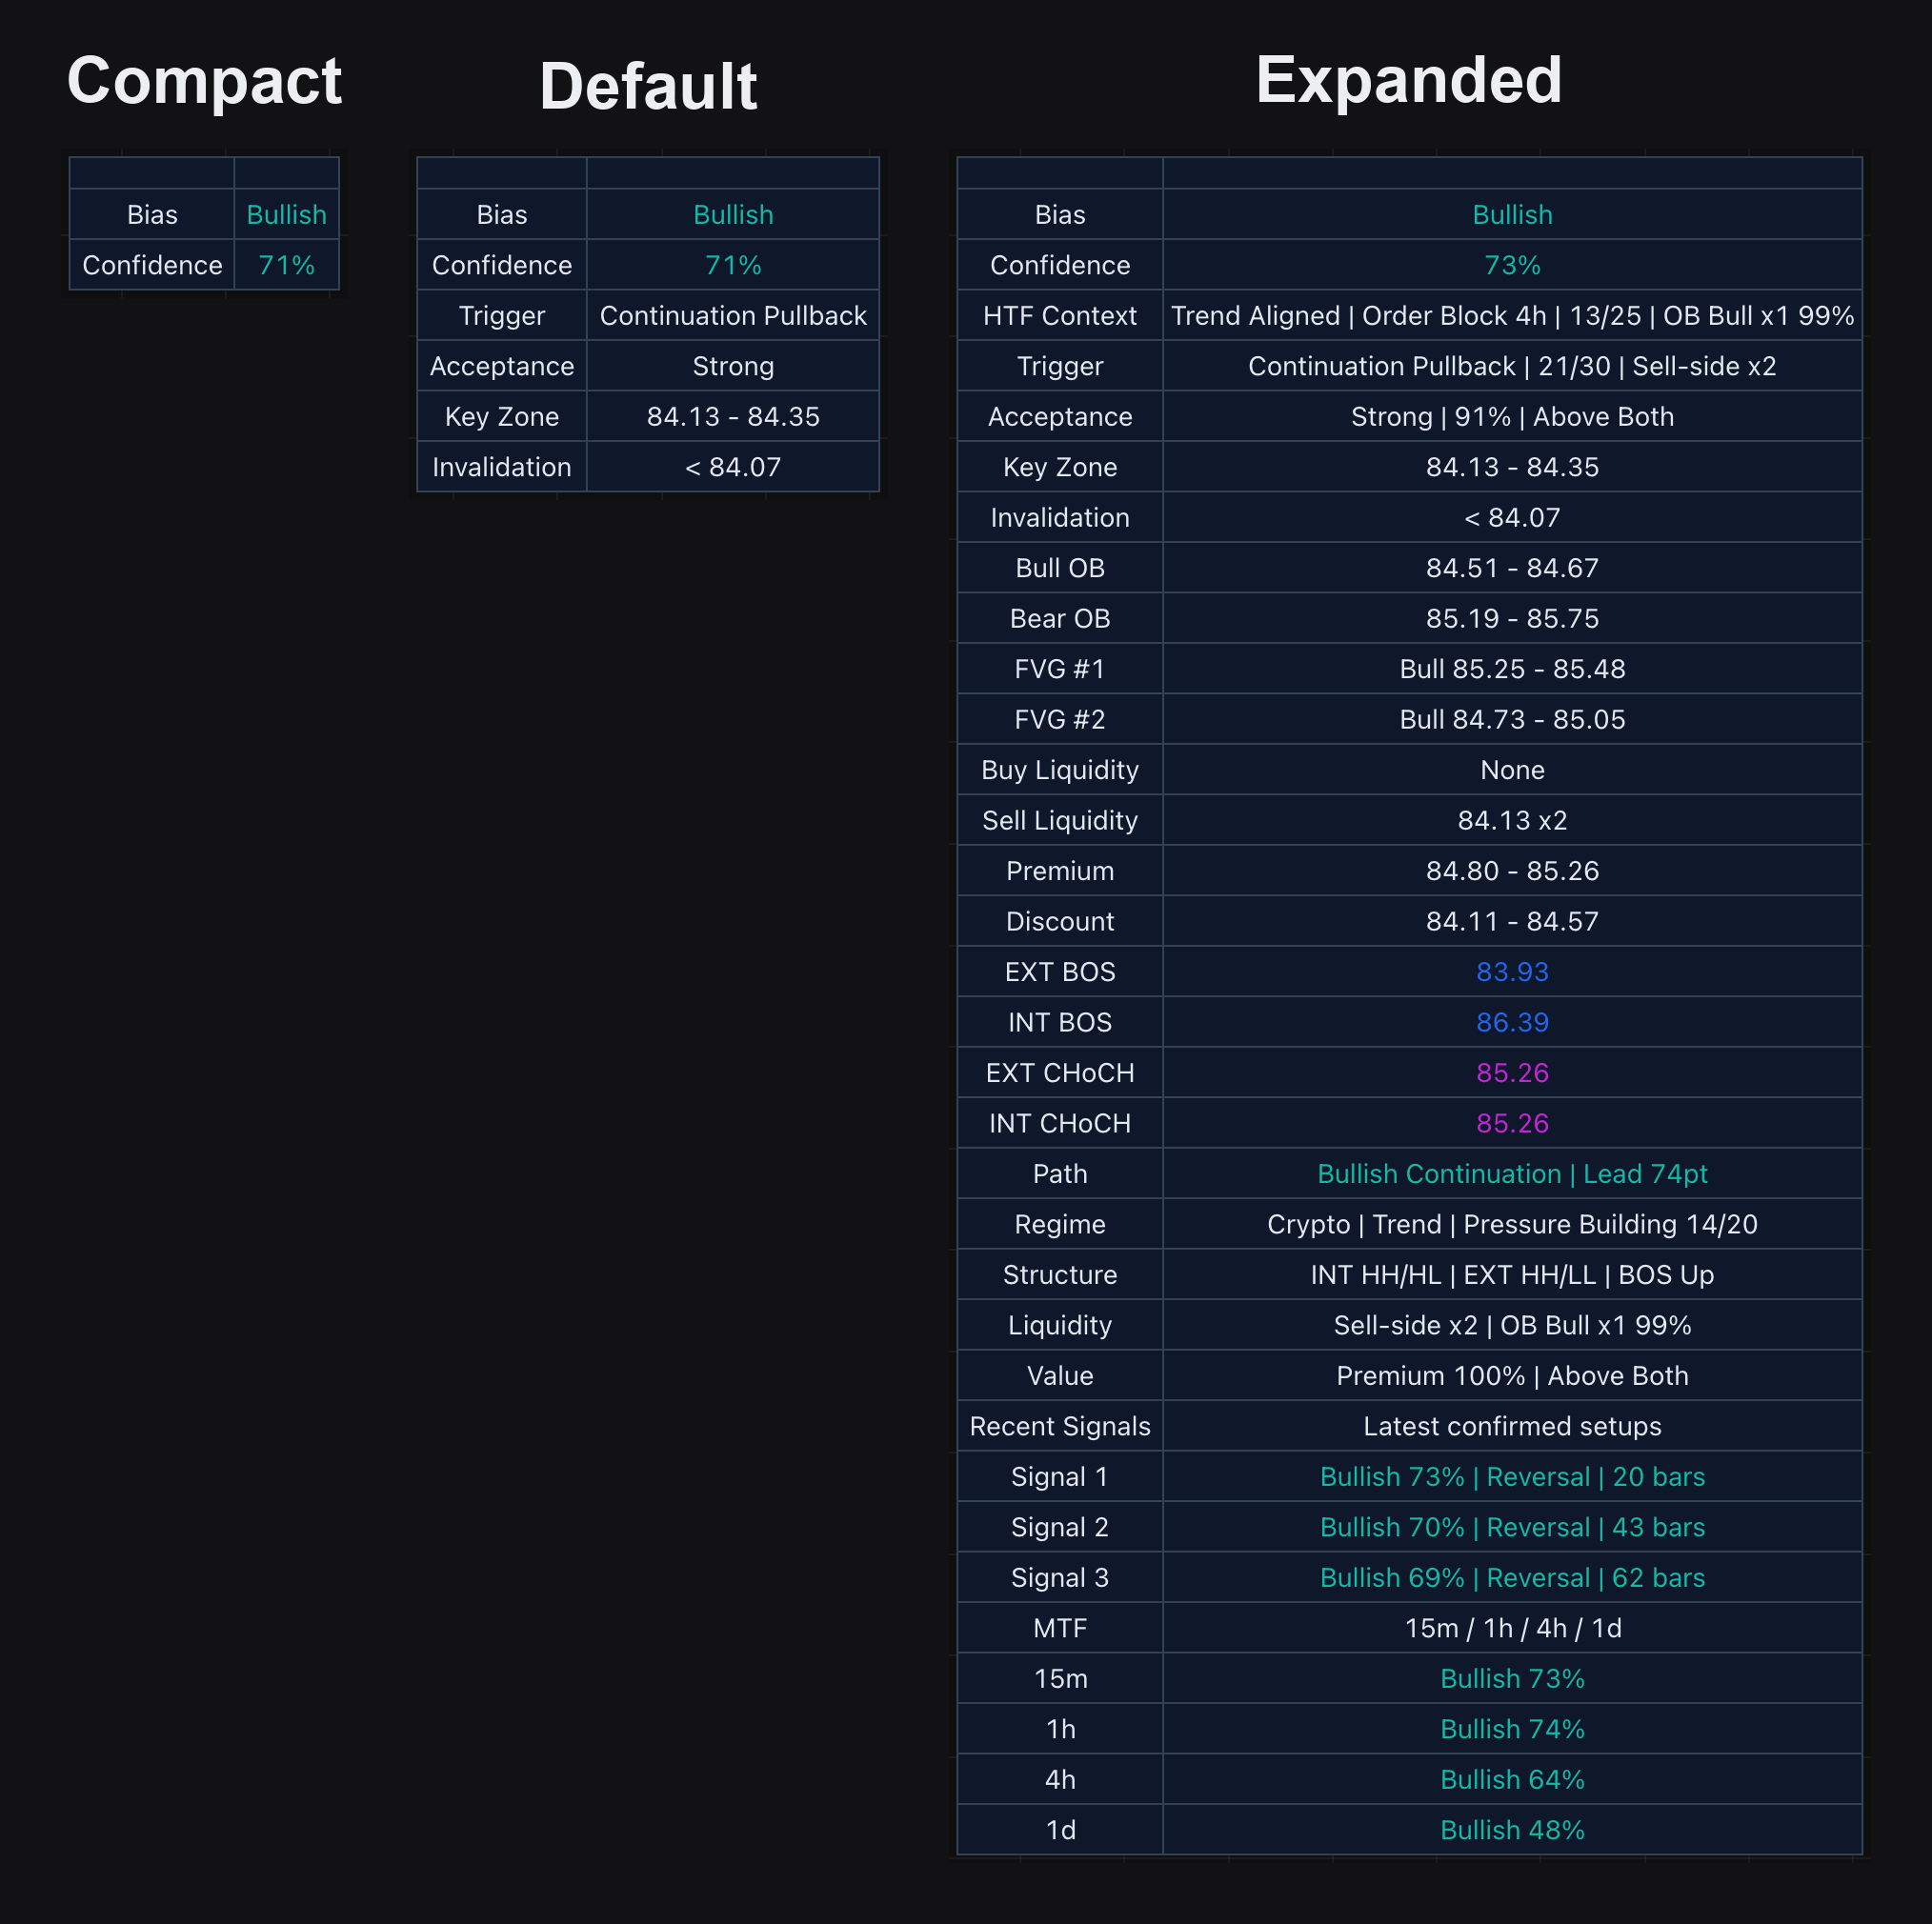
What the dashboard shows scales with the mode you choose. In Compact mode it stays out of the way. In Default mode it gives you the four rows that explain the current setup. In Expanded mode it becomes a full diagnostic surface with structure, liquidity, value, recent signals, MTF, footprint status, and overlay rows when those overlays are on.
The dashboard panel summarizes the engine's current read in one place — bias, confidence, trigger, acceptance, and reference levels.
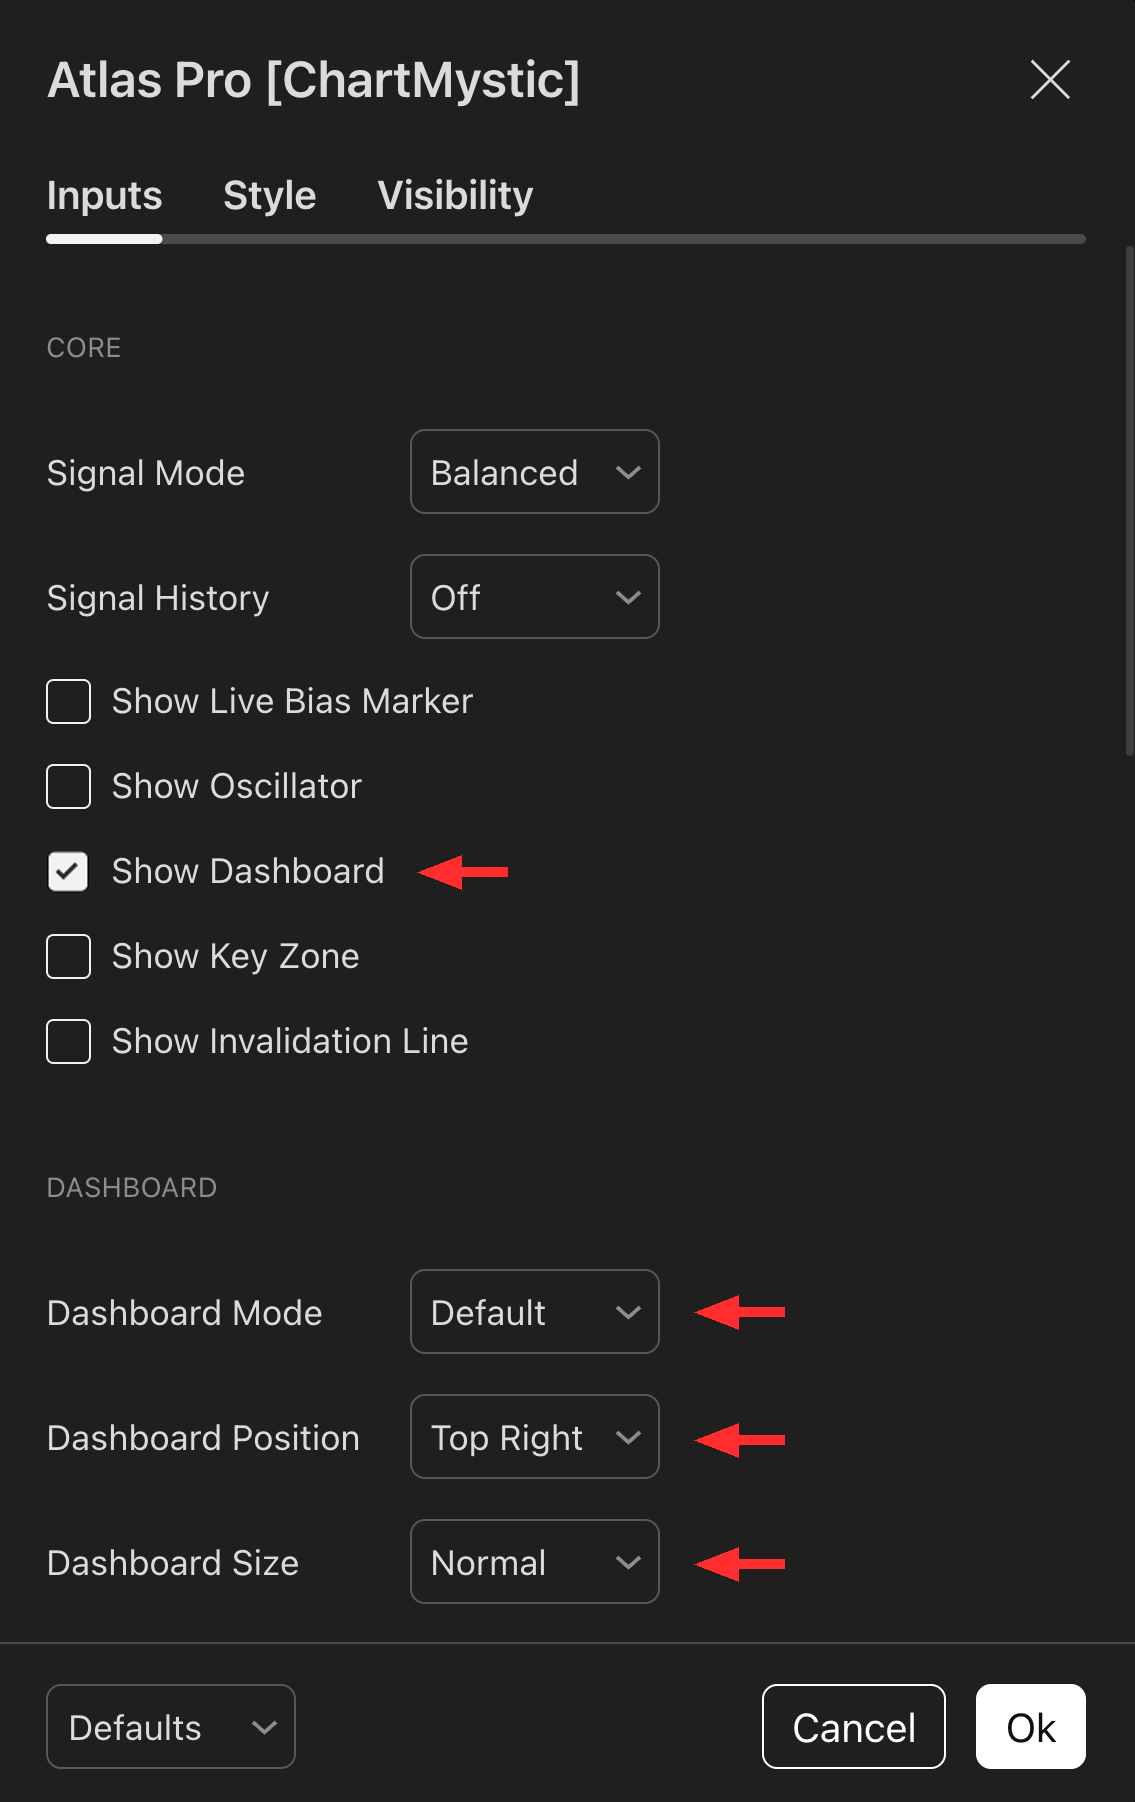
Enable Show Dashboard under the Core section to turn it on. Use the dropdowns in the Dashboard section below to adjust Dashboard Mode (Compact / Default / Expanded), Dashboard Position (any corner), and Dashboard Size (Compact / Normal).
Dashboard Modes
Compact
Keeps only the directional read and confidence visible. Use it when chart space matters more than diagnostics.
Default
The recommended starting point. It surfaces the four rows that explain the current setup: direction, confidence, trigger, and acceptance. Key Zone, Invalidation, and any active overlay rows appear here too.
Expanded
The full diagnostic view. Use it when you want to understand why the read looks the way it does, not just what the read is. It adds HTF Context, Path, Regime, Structure, Liquidity, Value, Recent Signals, MTF rows, and Footprint status.
The rows below are grouped into five families. Each family answers a different question about the chart.
Identity Rows
These rows tell you what Atlas Pro currently sees. They are the first thing your eye should hit. Direction is the side currently supported by the strongest evidence (Bullish, Bearish, or Neutral). Confidence is the strength of that read as a percentage. HTF Context (Expanded) summarizes the higher-timeframe state shaping the current view.
- Bias — current side
- Confidence — strength of the current side
- HTF Context (Expanded) — higher-timeframe environment
Setup Rows
These rows tell you why the current read exists. Trigger names the event that brought the setup into focus. Acceptance reports whether the market is honoring that trigger. Path (Expanded) names whether the setup is a reversal or continuation — useful when two charts show the same direction for different reasons.
- Trigger — the event that activated the setup
- Acceptance —
Pending/Rejected/Weak/Building/Strong - Path (Expanded) — reversal or continuation
Acceptance is the most important diagnostic row on the panel. Pending means no meaningful read yet; Rejected means the thesis broke; Weak means wait for clarification; Building means give it room; Strong means lean in. The Auction Acceptance Score is what gates a confirmed marker from printing.
Reference Rows
These rows tell you what the setup is leaning on. Key Zone is the primary support or resistance area the active confirmed setup is referencing. Invalidation is the level that breaks it. Both appear when the corresponding setting is enabled and the active signal has a valid reference.
- Key Zone — current key price range
- Invalidation — current invalidation level
Neither row is a stop-loss instruction. They are Atlas Pro's reference levels for the setup it has marked. Full treatment in the Key Zone And Invalidation Line section.
Overlay Rows
These rows surface the institutional context — order blocks, fair value gaps, structure breaks, liquidity pools, and premium/discount bands. Each row appears only when its corresponding overlay is enabled, and each is intentionally brief. The detailed treatment for each family lives in its own section.
- Bull OB / Bear OB — nearest order block per side
- FVG #1 / FVG #2 — two nearest active fair value gaps
- EXT BOS / INT BOS — last external and internal Break of Structure
- EXT CHoCH / INT CHoCH — last external and internal Change of Character
- Buy Liquidity / Sell Liquidity — best liquidity pool per side, with cluster size
- Premium / Discount — upper and lower bands of the active range
These rows let you answer a quick question — "is there a relevant zone nearby?" — without zooming into a chart drawing.
Diagnostic Rows
These rows give you environmental context for the current read. Regime names the active market profile. Value summarizes where price sits inside the active range and how AVWAP is lining up. Recent Signals shows the latest confirmed history so you can pick up a chart late. Footprints reports whether Footprint Precision Mode is contributing to the current read. MTF rows show the Atlas Pro read for each enabled timeframe slot. Startup and Status rows replace normal output when Atlas Pro is warming up or the chart is unsupported.
- Regime — current market profile (range, trend, compression, expansion)
- Value — value-range location and AVWAP context
- Recent Signals — last few confirmed setups, side, confidence, bars-ago
- Footprints —
Enabled/Active/Fallback - MTF rows — per-timeframe bias and confidence
- Startup / Status —
History Warmup,Unsupported Chart, etc.
Dashboard Position And Size
The Dashboard can sit in any corner — Top Right, Top Left, Bottom Right, Bottom Left — and renders at Normal or Compact size. If the chart feels crowded, drop the size or move the panel to a corner with less price action.
How To Read The Dashboard
Start with five questions:
- What is the current directional read?
- How confident is Atlas Pro?
- What triggered the read?
- Is acceptance
Pending,Rejected,Weak,Building, orStrong? - Is the read near a Key Zone, Invalidation Line, structure level, liquidity pool, or value boundary?
If you are new, learn Default mode first. Once the four core rows feel automatic, turn on Expanded and add one optional overlay at a time. Resist the urge to enable everything — the dashboard's value comes from what you can scan in a single glance.
Dashboard Row Reference
| Row | Mode | Possible Values | Meaning |
|---|---|---|---|
| Bias | All | Bullish / Bearish / Neutral | Current directional read |
| Confidence | All | 0–100% | Strength of the read |
| Trigger | Default+ | Liquidity Reclaim, Structure Break, Continuation Pullback, etc. | What event brought the setup into focus |
| Acceptance | Default+ | Pending / Rejected / Weak / Building / Strong | Whether the market is honoring the trigger |
| HTF Context | Expanded | Discount Demand, Premium Supply, Trend Aligned, etc. | Higher-timeframe state |
| Path | Expanded | Reversal / Continuation | Setup type |
| Regime | Expanded | Range, Trend, Compression, Expansion | Current market profile |
| Structure | Expanded | summary | Internal + external structure state |
| Liquidity | Expanded | summary | Current liquidity pool context |
| Value | Expanded | summary | AVWAP + value-range location |
| Key Zone | Default+ (if enabled) | price range | Active setup's key support/resistance area |
| Invalidation | Default+ (if enabled) | price | Active setup's failure reference |
| Bull OB / Bear OB | Default+ (if overlay on) | level summary | Nearest order block per side |
| FVG #1 / FVG #2 | Default+ (if overlay on) | level summary | Two nearest active fair value gaps |
| EXT BOS / INT BOS | Default+ (if overlay on) | price | Last break of structure (external / internal) |
| EXT CHoCH / INT CHoCH | Default+ (if overlay on) | price | Last change of character (external / internal) |
| Buy Liquidity / Sell Liquidity | Default+ (if overlay on) | price + cluster size | Best pool per side |
| Premium / Discount | Default+ (if overlay on) | band | Range zones |
| Recent Signals | Expanded | last 3 signals | Recent confirmed history |
| Footprints | Expanded (if enabled) | Enabled / Active / Fallback | Footprint refinement state |
| MTF rows | Expanded (if enabled) | timeframe bias % | Per-timeframe read |
| Startup / Status | All | History Warmup, Unsupported Chart | Replaces normal output during warmup or on unsupported charts |