Key Zone And Invalidation Line
How Atlas Pro draws the active setup zone and invalidation reference.
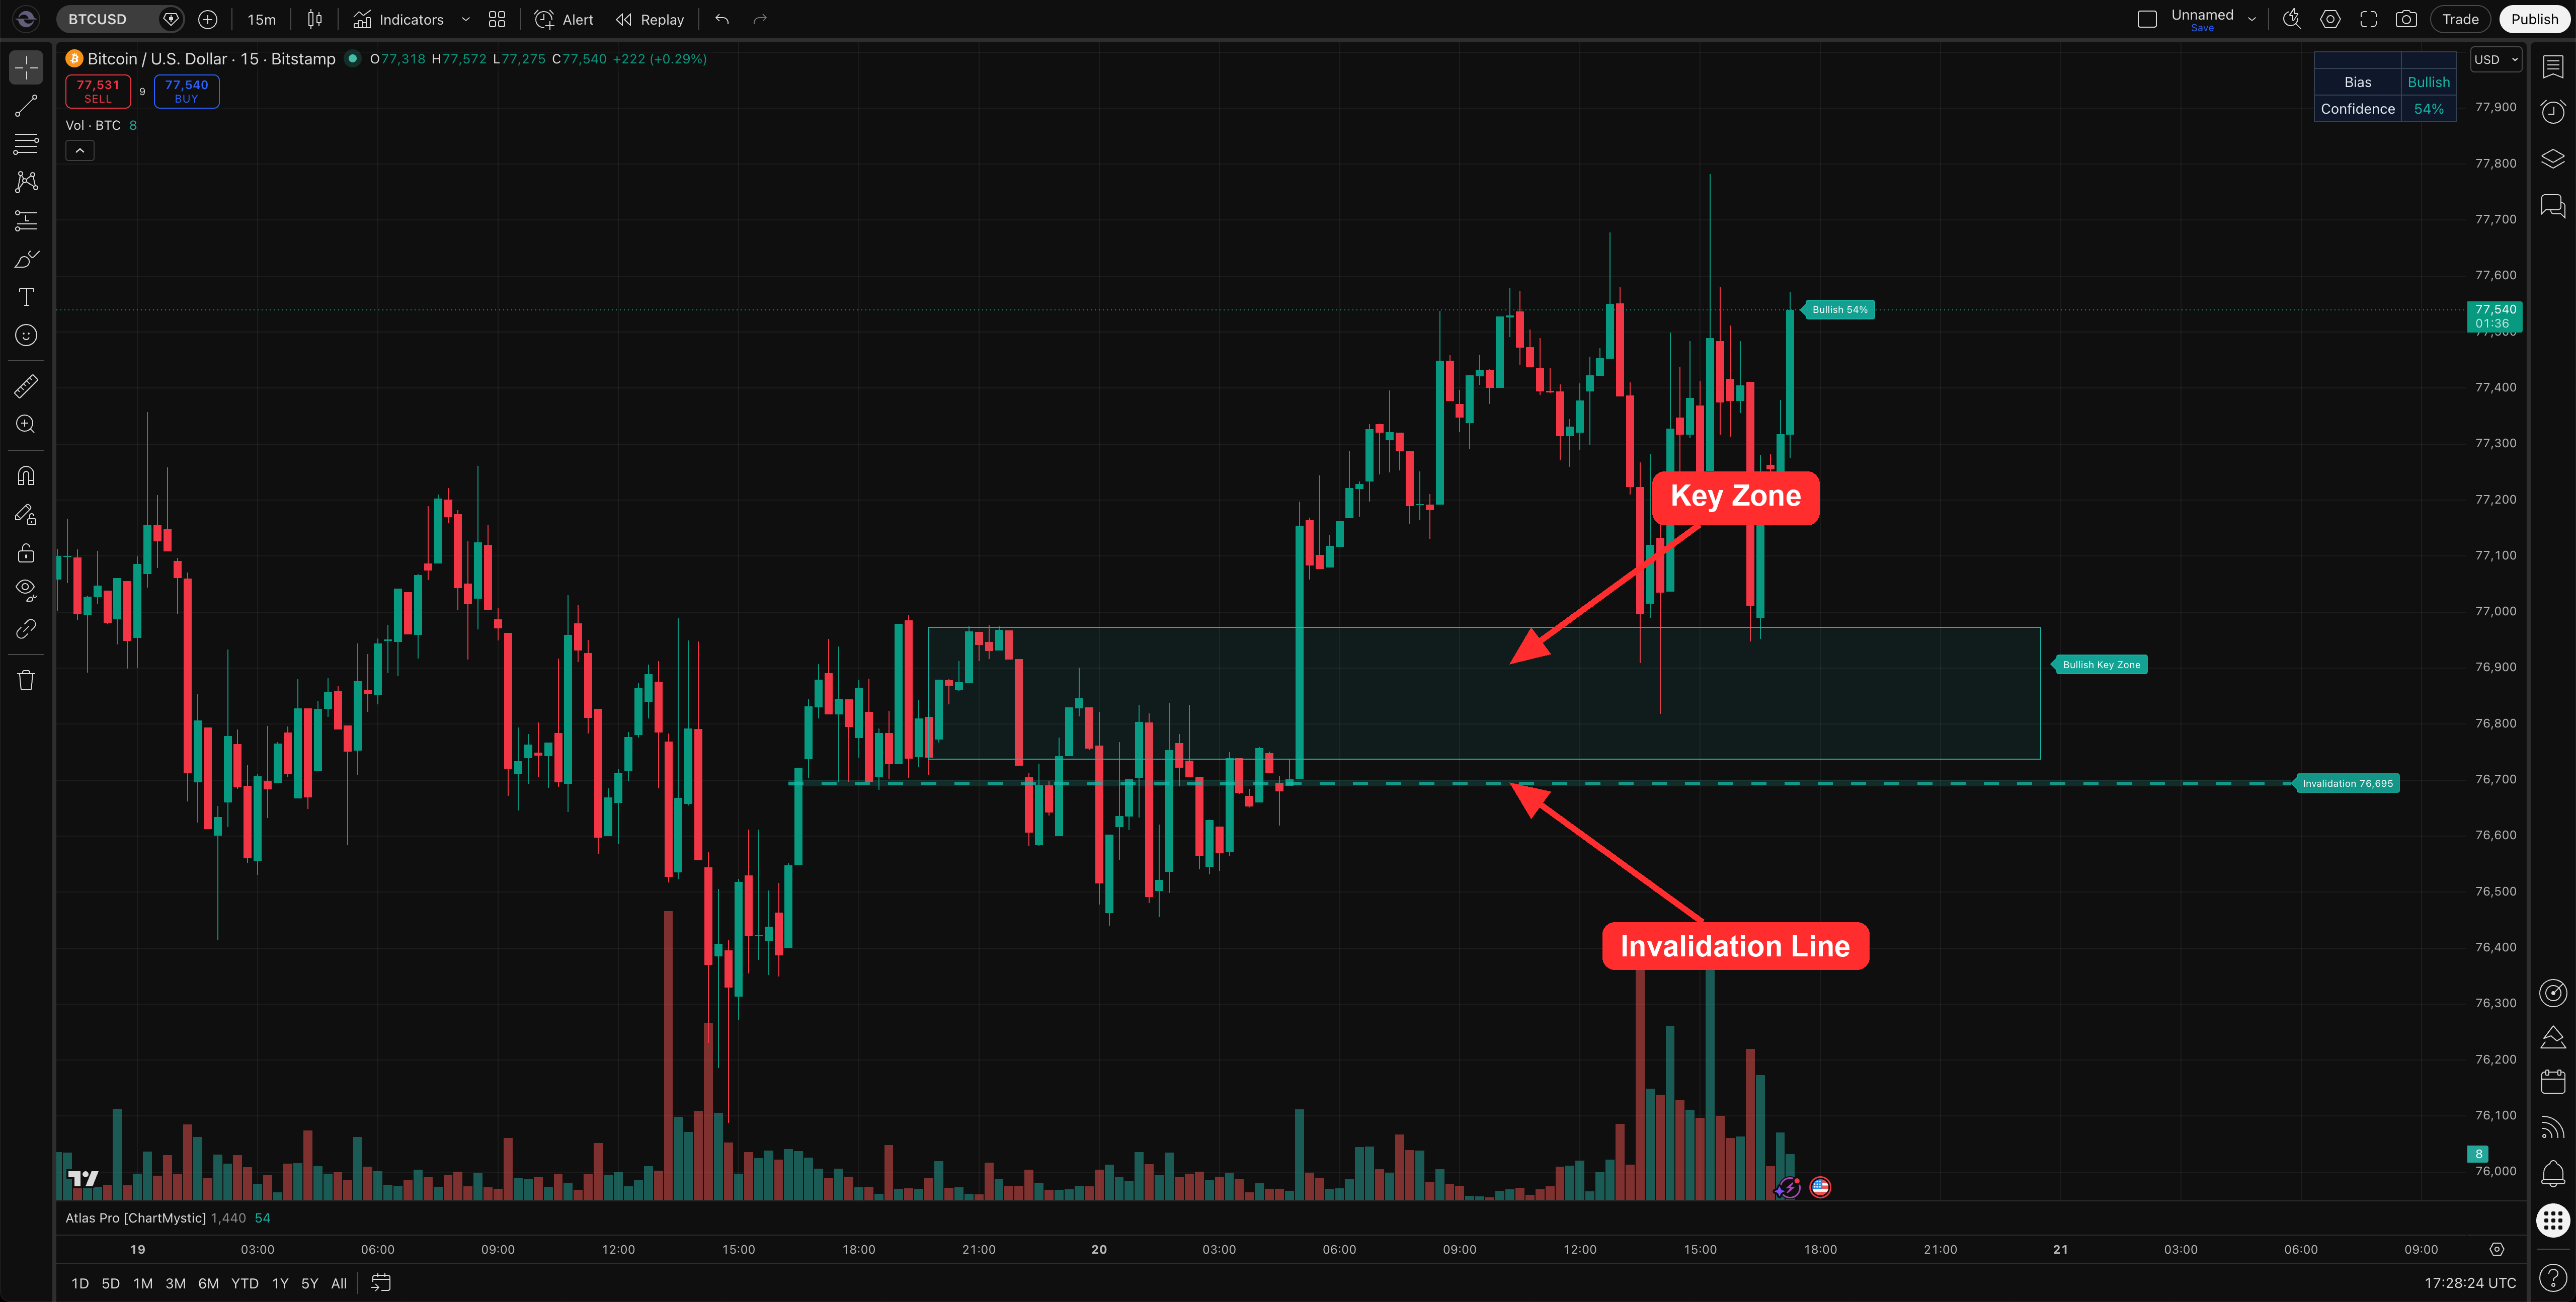
The Key Zone and Invalidation Line are the two chart references tied to the active confirmed setup. The Key Zone is the area the thesis is leaning on. The Invalidation Line is the level that breaks it.
They are not automatic trade instructions. They are the engine's published reference geometry for the setup it has just marked.
The Key Zone and Invalidation Line are the anatomy of every confirmed Atlas Pro setup. The Key Zone is the zone the thesis is leaning on; the Invalidation Line is the level that would break it.
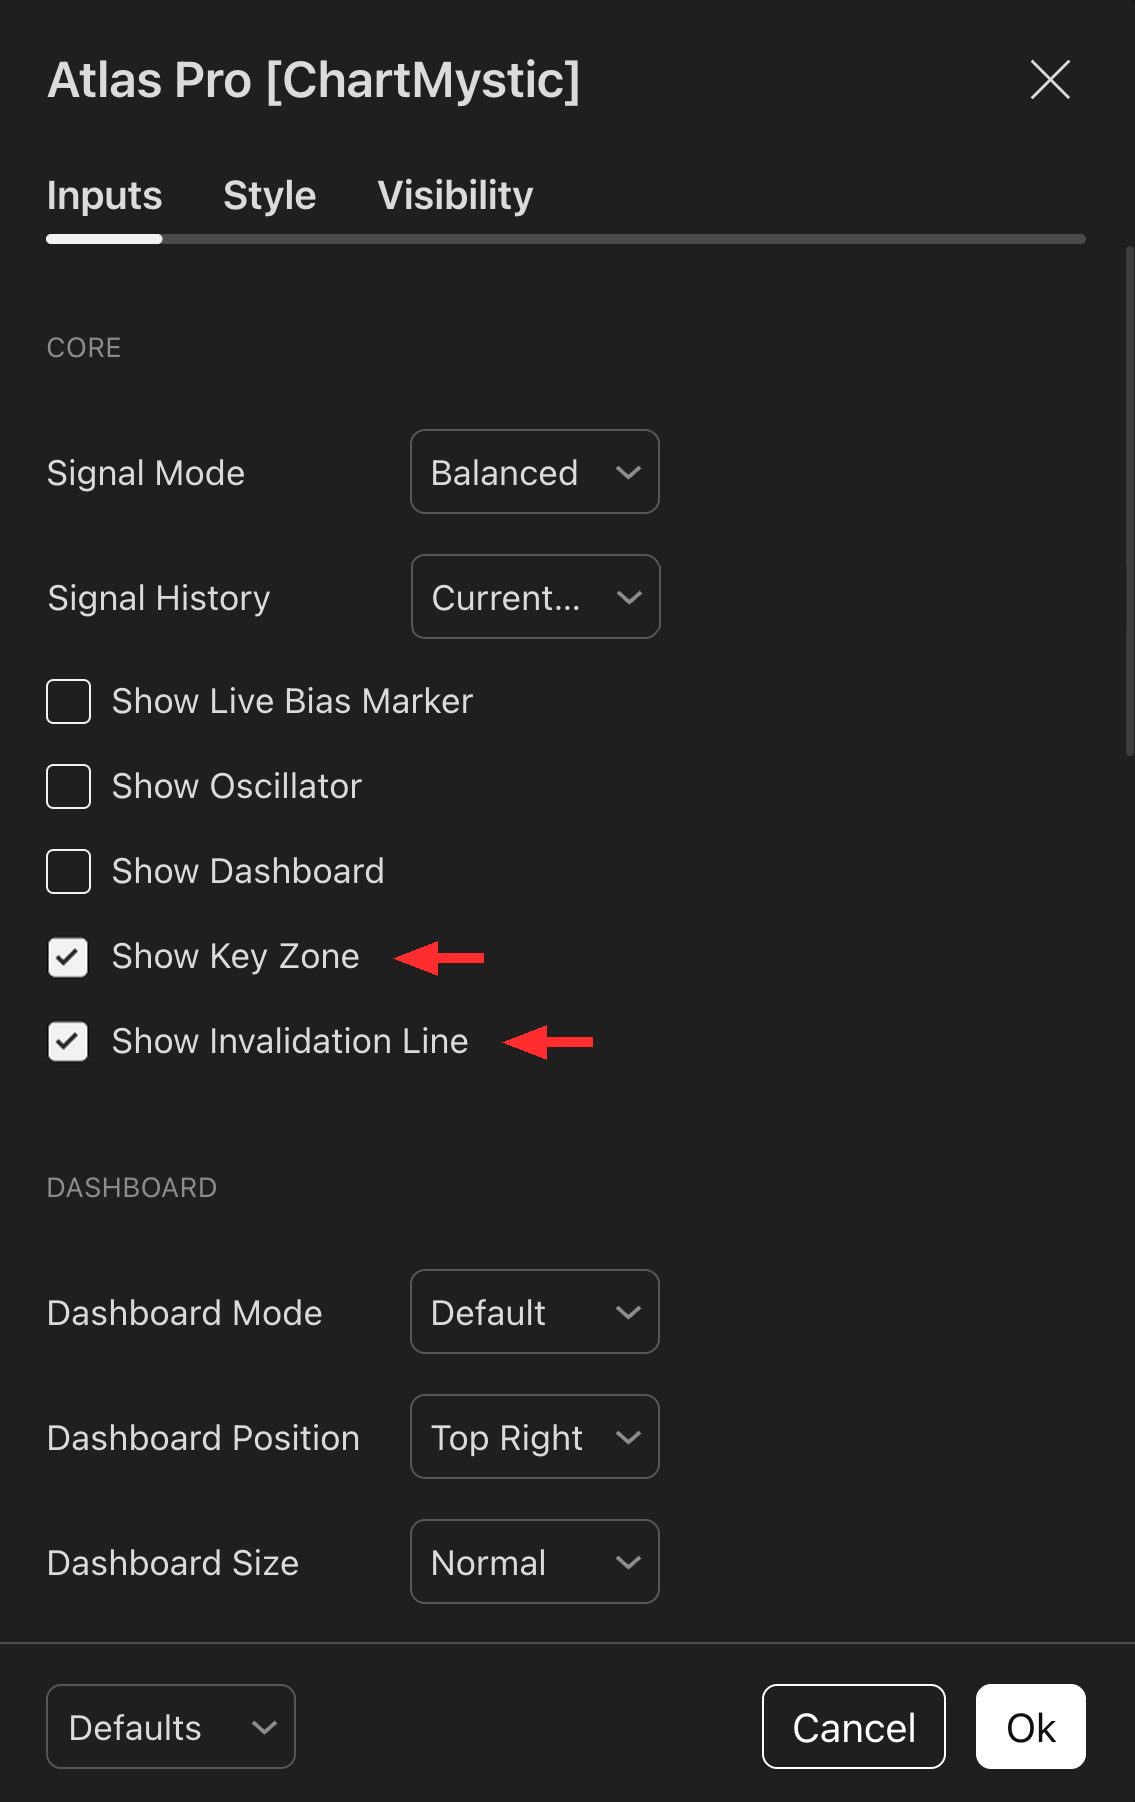
Enable both Show Key Zone and Show Invalidation Line under the Core section so both elements appear on the chart whenever a confirmed setup is active.
Every confirmed signal ships with a level to lean on and a level to invalidate it.
Atlas Pro never publishes a confirmed marker without anchoring it to chart geometry. The Key Zone is where the setup makes sense. The Invalidation Line is where it stops making sense. Both move together with the active confirmed signal.
Key Zone
The Key Zone highlights the most relevant support or resistance area Atlas Pro is referencing for the active setup. Use it to anchor the signal in real chart context instead of reading the marker as if it exists in empty space.
The zone is not drawn from a single fixed formula. Atlas Pro resolves it from the active signal context — depending on what produced the setup, it may be tied to a relevant order block, a fair value gap, a defended portion of a zone, or a fallback band around the active invalidation reference.
When a confirmed signal prints, Atlas Pro stores the key-zone bounds with that signal. The visible zone is then projected forward from its source area so you keep seeing the price region the setup is leaning on.
Why The Key Zone Can Move From Setup To Setup
Different setups lean on different evidence.
A continuation setup may reference a pullback zone. A reversal-style setup may reference a sweep-and-reclaim area, a nearby imbalance, or a structural zone price has defended. A setup near a clean order block uses that order block as the more useful reference. A setup with less clean zone context relies more heavily on its invalidation reference.
Read the Key Zone as "the most relevant support/resistance area for this active signal" — not as a generic zone drawn the same way on every chart.
Invalidation Line
The Invalidation Line shows the level that challenges the active setup thesis. If price moves through it, the setup context has changed and the original thesis no longer deserves the same trust.
Atlas Pro derives the invalidation reference from several pieces of setup context — zone boundaries, sweep/reclaim references, pullback structure, internal or external structure levels. The visible line keeps enough visual separation from the Key Zone to keep the chart readable.
Not a stop-loss
The Invalidation Line is Atlas Pro's failure reference for the marked setup. It is not a universal stop-loss, and it is not a promise that price cannot wick through and recover. Your stop placement, sizing, and risk management remain your responsibility — the Invalidation Line just tells you when the engine considers the active thesis broken.
Active Signal Context
The Key Zone and Invalidation Line follow the most recent active confirmed signal context. If that signal is invalidated, the visual state updates accordingly. The dashboard can also show the active Key Zone range and Invalidation level so you can read those references even when the chart is visually crowded.
How To Use These Levels
Use the Key Zone and Invalidation Line to ask:
- Where is the setup being supported or challenged?
- Is price respecting the relevant area?
- Is the current read still consistent with the level structure?
- Has price moved through the invalidation reference?
- Does the dashboard still show clean acceptance after price interacts with the zone?