Order Blocks
Use order blocks as optional supply and demand context around the current Atlas Pro read.
Imagine price has just bounced off a level you traced two sessions ago — a tight band where the last meaningful seller stepped in before a sharp drop. That band is an order block. The question is never whether the block exists. It is whether the market still respects it.
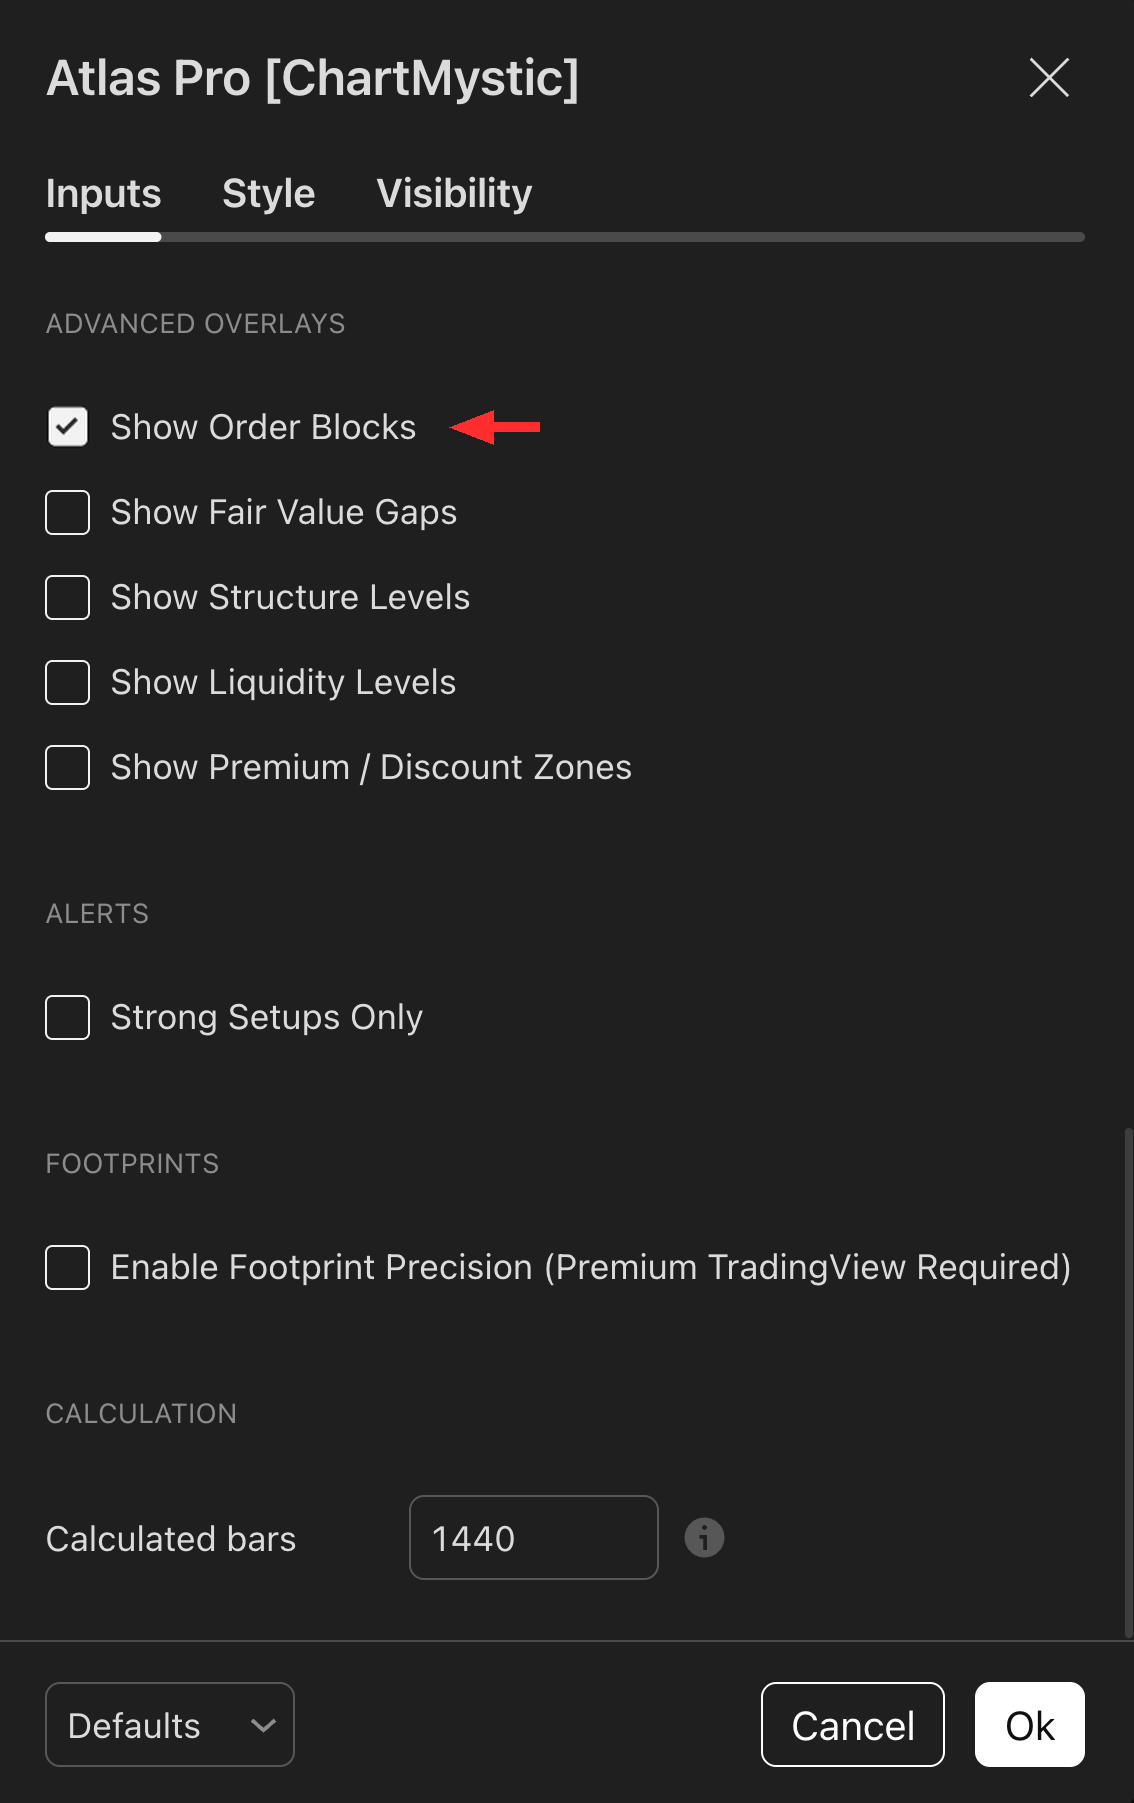
Order Blocks are off by default. Enable them when you want that supply or demand context layered onto the active Atlas Pro read.
Order blocks are bullish and bearish institutional reference zones drawn on the chart at significant supply / demand prints.
Enable Show Order Blocks under the Advanced Overlays section to render them. Atlas Pro filters which blocks display so only the relevant ones near current price appear — keeping the chart from getting cluttered with old structure.
What An Order Block Is
An order block is a structural supply or demand zone associated with meaningful participation before price moved away. It marks the area where the last decisive buyer or seller sat before a displacement leg. Traders watch these zones because price can return, react, and either honor the area or invalidate it.
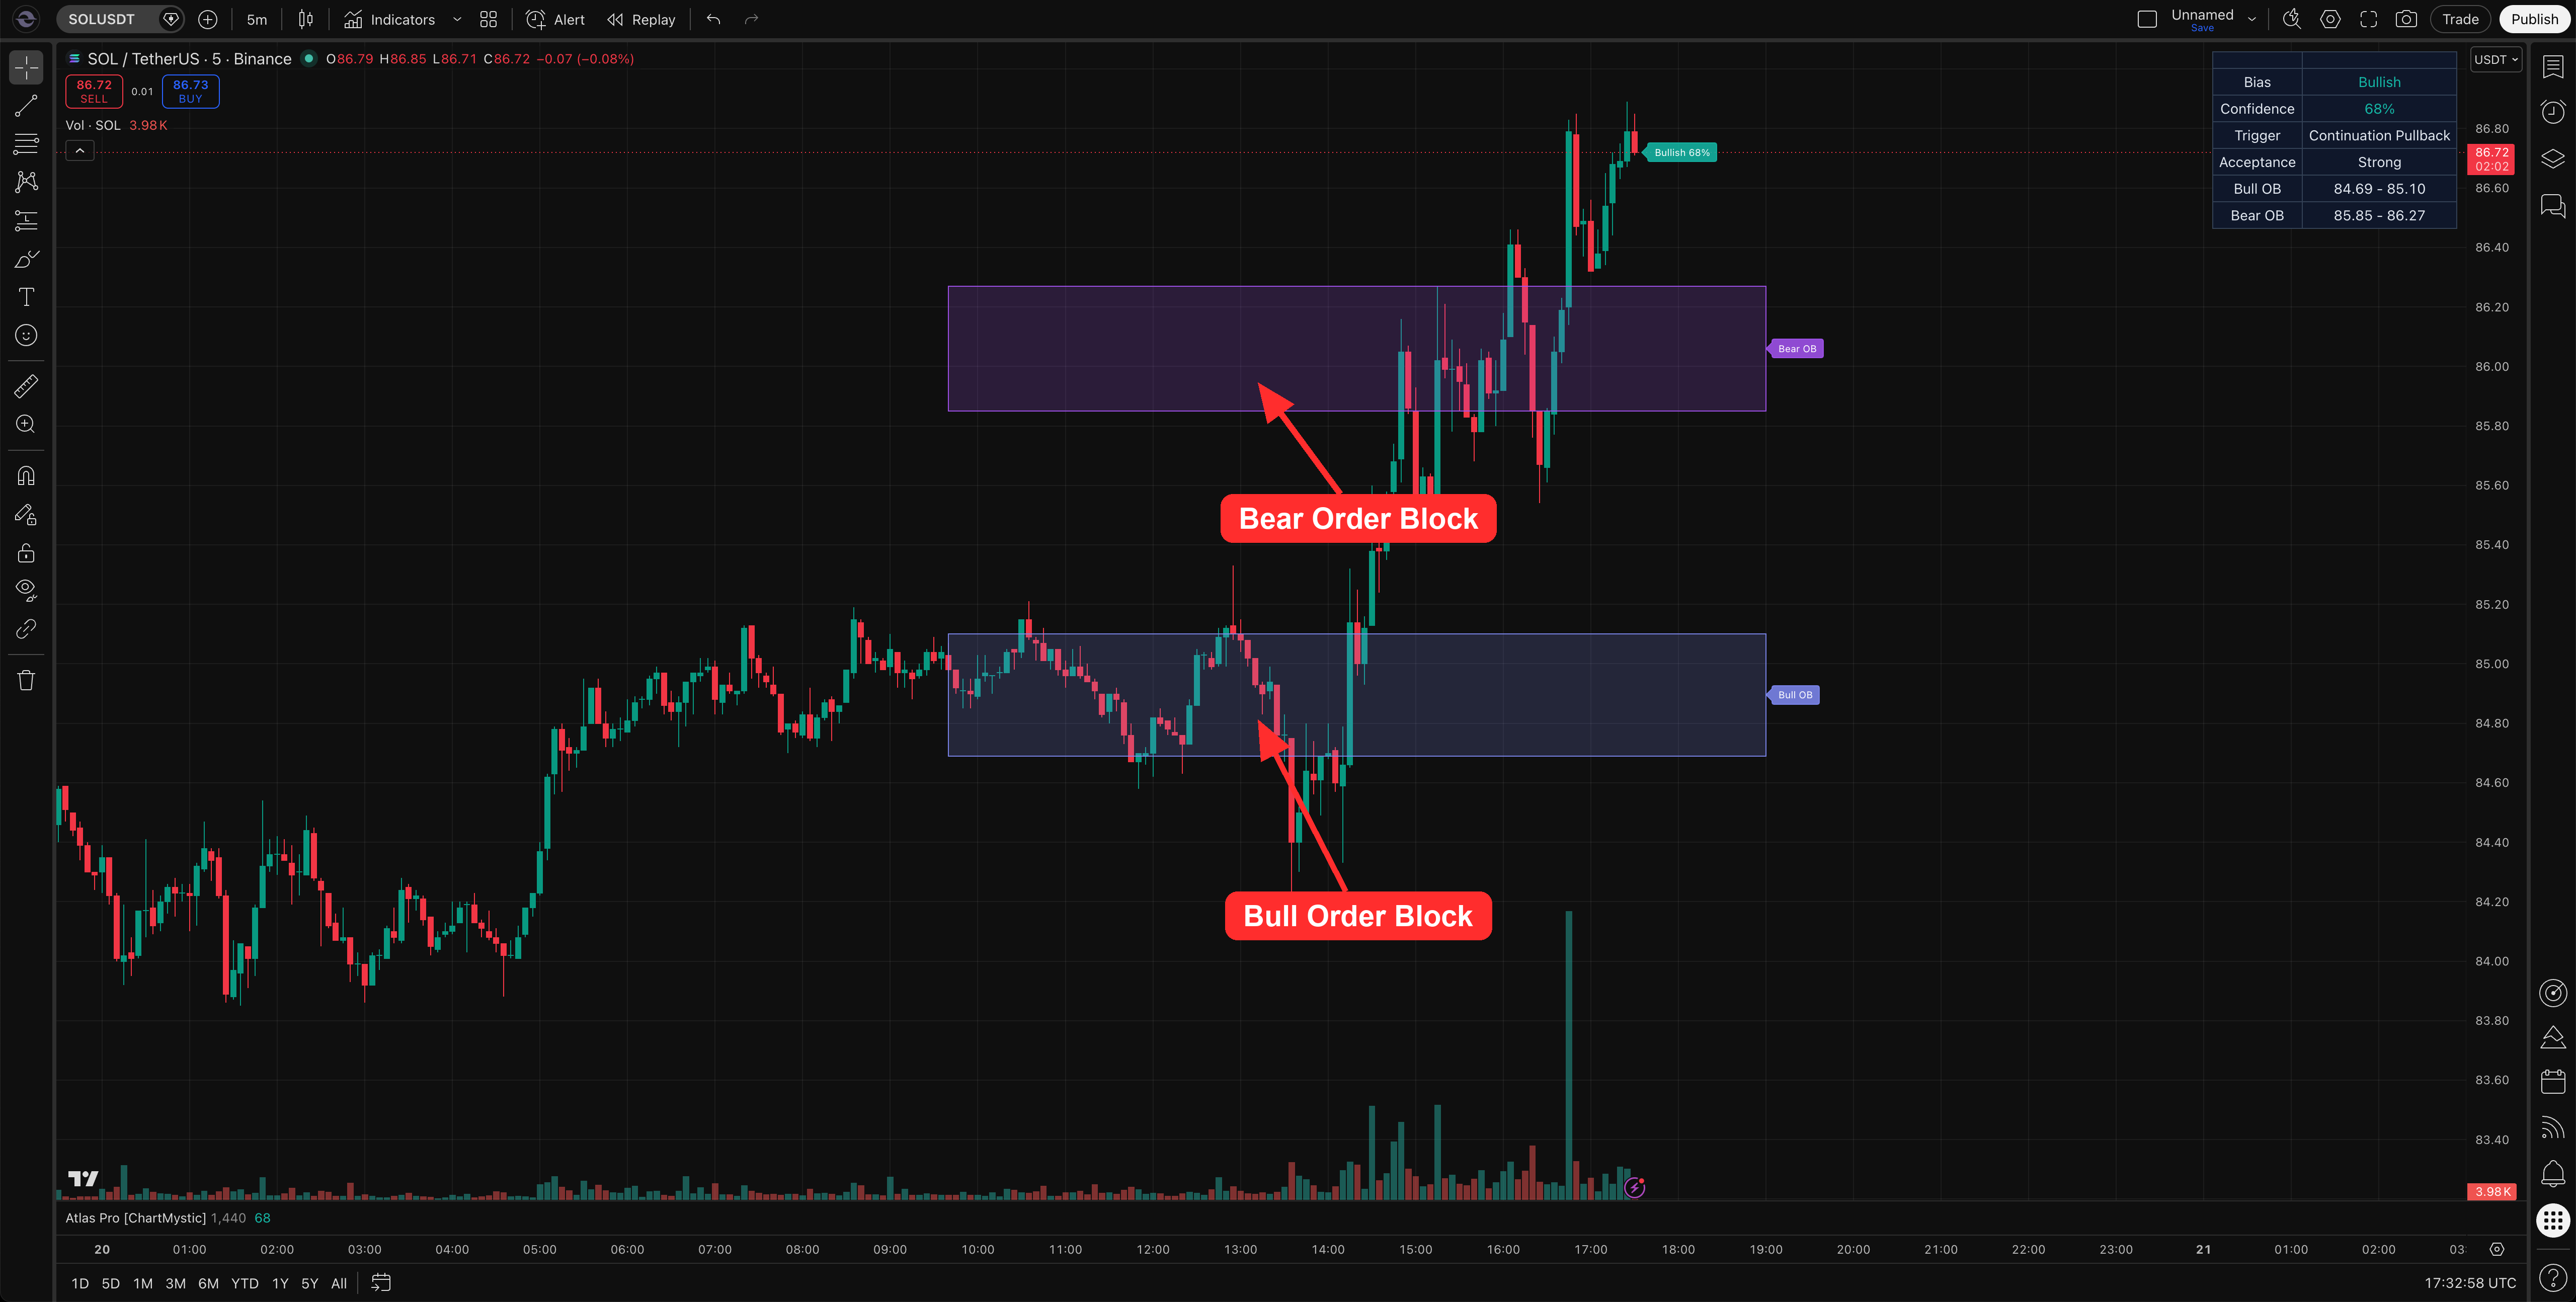
In Atlas Pro, order blocks are reference zones for context. A bullish block sits below price as a demand floor; a bearish block sits above as a supply ceiling. Neither is a standalone trade trigger.
How Atlas Pro Uses Order Blocks
A nearby same-side block can reinforce setup context, shape where the Key Zone draws, and feed the dashboard's Bull OB and Bear OB rows when the overlay is on. Those rows summarize the most relevant bullish and bearish blocks within reach of current price — the chart gives you the zone, the dashboard gives you the quick reference.
Atlas Pro weighs blocks by proximity, freshness, and same-side context. A textbook block deep in unrelated territory will not surface; a recent block aligned with the active thesis will.
A reclaim vs a wick-through
A reclaim. Price trades into a bullish order block, prints a rejection wick, and closes back inside the zone on the next bar. Acceptance often upgrades. The block held — the demand it represented showed up.
A wick-through. Price slices the same block on a single expansion candle, closes through, and never reclaims. The block did not hold. Treat it as broken context, not as buyable demand.
How To Enable Order Blocks
Open Atlas Pro Settings
Open the indicator settings from the TradingView chart where Atlas Pro is already applied.
Enable Show Order Blocks
Find the Advanced Overlays controls and toggle Show Order Blocks on.
Review The Chart
Check whether the blocks add useful context. If the chart feels crowded, disable other overlays before adjusting block settings.
How To Read Order Blocks With Atlas Pro
Five questions to run through each time:
- Is the current directional read interacting with a same-side order block?
- Is the Key Zone sitting on or near a block?
- Is price reclaiming the zone, or slicing through it?
- Has a confirmed signal printed near the block, or in open space?
- Does the dashboard's Bull OB or Bear OB row agree with the side you are reading?
Order blocks matter most when they line up with the rest of the Atlas Pro context. A block on its own is geometry; a block with acceptance and a Key Zone is a trade thesis.
Example Use
Atlas Pro confirms Bullish 72% while price reclaims a bullish order block from below. Acceptance prints Strong. The block helps explain where demand showed up and why the Key Zone is anchored to that area. If price later loses the block and trades through the Invalidation Line, the original thesis is over — not because the block was wrong, but because it was no longer being honored.
Common mistakes
- Treating every block as buyable demand or sellable supply. A block that price has already swept and closed beyond is no longer doing structural work.
- Stacking too many overlays at once. With Order Blocks, FVG, and Structure all enabled, the chart becomes noise. Enable one family at a time when you are studying setups.
- Ignoring the side of the block. A bullish setup leaning on a bearish block above is leaning the wrong way. Match block side to thesis side.