Generate A Strategy
Create Pine Script strategies with entries, exits, risk logic, and Strategy Tester support.
Ask Scribe Studio for a strategy when you want entries, exits, and a Strategy Tester report. The shape of the script changes — and so does what you need to put in the prompt.
Indicator vs Strategy
The two script types do different jobs in Pine, and only one of them can actually be backtested.
| Indicator | Strategy | |
|---|---|---|
| Primary purpose | Show information on the chart | Test entry and exit logic across history |
| What it produces | Plots, fills, colors, labels, and alert conditions | Simulated trades with P&L, drawdown, win rate, and a full trade list |
| Order calls | None | strategy.entry(), strategy.exit(), strategy.close() |
| Backtesting | Not possible — there are no orders for the tester to replay | Generates a complete Strategy Tester report |
| Use it when | You want to see a setup | You want to test a setup |
If your idea has entry and exit rules and you want to know whether they would have made money, you need a strategy — not an indicator.
Strategy Workflow
Start a new Scribe Studio chat. A fresh chat keeps the conversation focused on this strategy.
Describe the strategy you want. Use the template below as a starting point — paste it, fill in the brackets, and send. The sections cover everything the Strategy Tester needs to produce a meaningful report. The more concretely you fill them in, the less Scribe has to guess.
Prompt templateCreate a Pine Script strategy for TradingView. Context: [Symbol or market type and the chart timeframe.] Goal: [Describe in detail what edge you are testing and why.] Entry rules: [Conditions that open a long, and a short (or "long only").] Exit rules: [What closes a trade besides the stop and target.] Stop loss: [Method and value, e.g. "1.5% from entry".] Take profit: [Method and value, or "none" if the exit rule handles it.] Position sizing: [e.g. "2% of equity per trade" or "1 contract".] Inputs: [Settings I should be able to tune.] Backtest realism: [Commission and slippage to match your broker, e.g. "0.02% + 1 tick".] Safety: Use bar-close confirmation. Flag any repainting risks.Copy the generated code. Use the copy button on Scribe's code block.
Paste it into TradingView's Pine Editor. Open Pine Editor at the bottom of any chart, paste the script, save it with a clear name, and click Add to chart.
ScreenshotCreating a new strategy in the Pine Editor 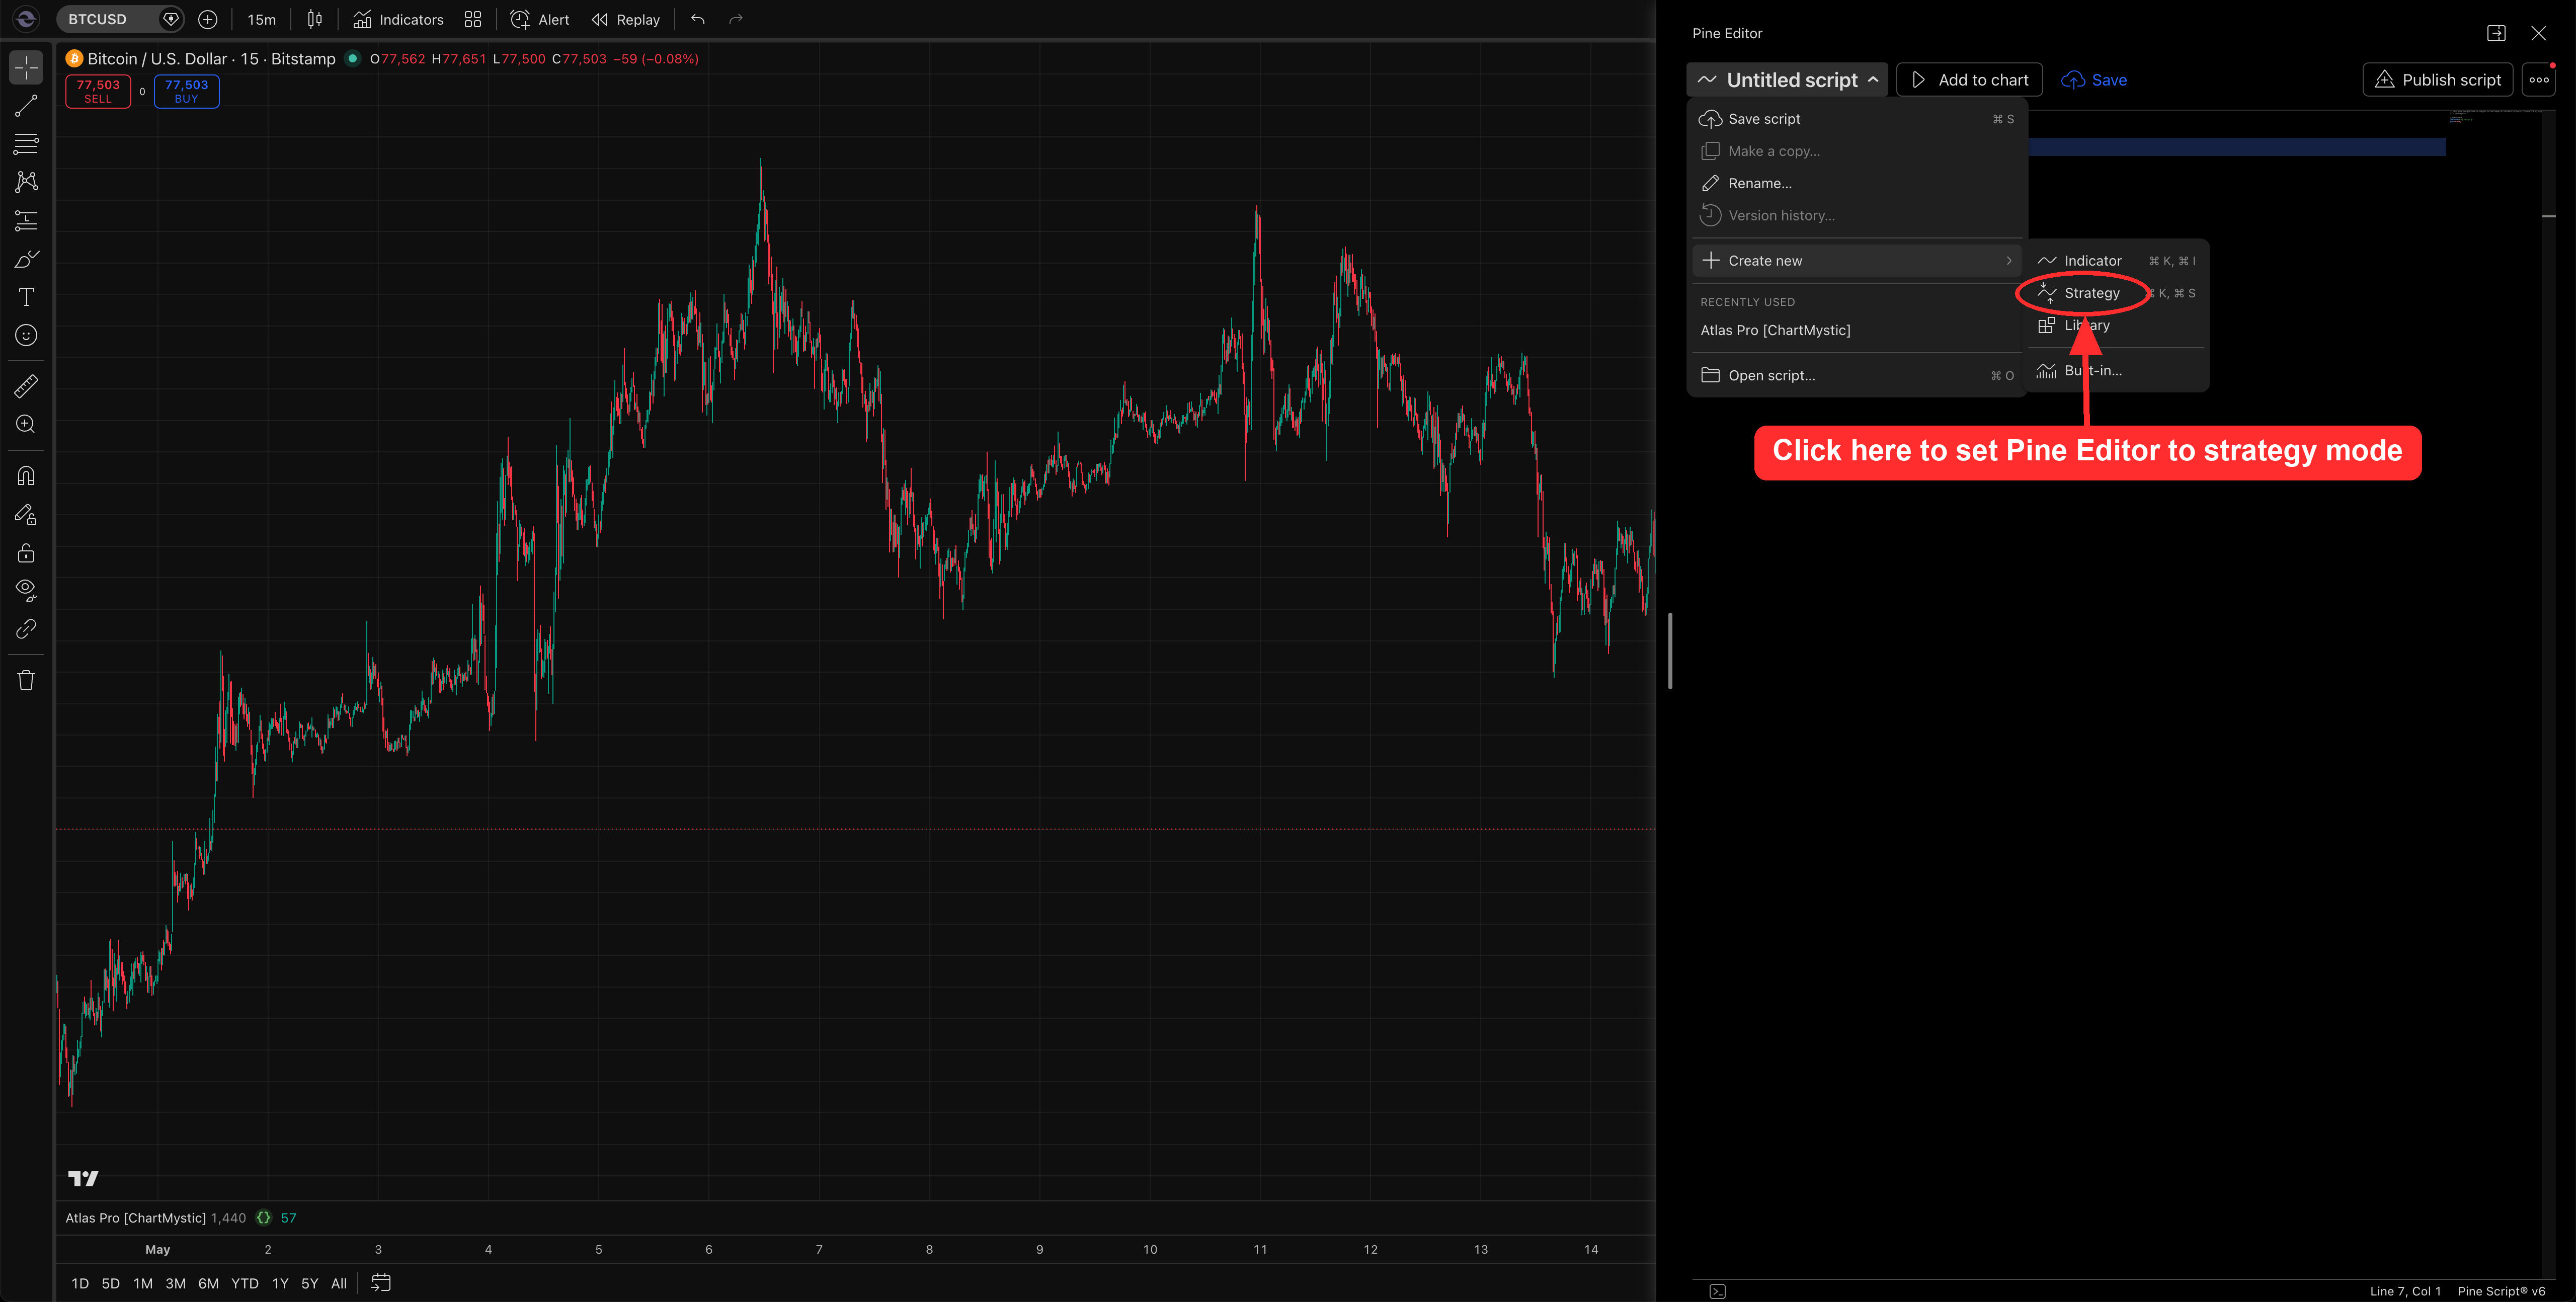 Screenshot
Adding the strategy to the chart 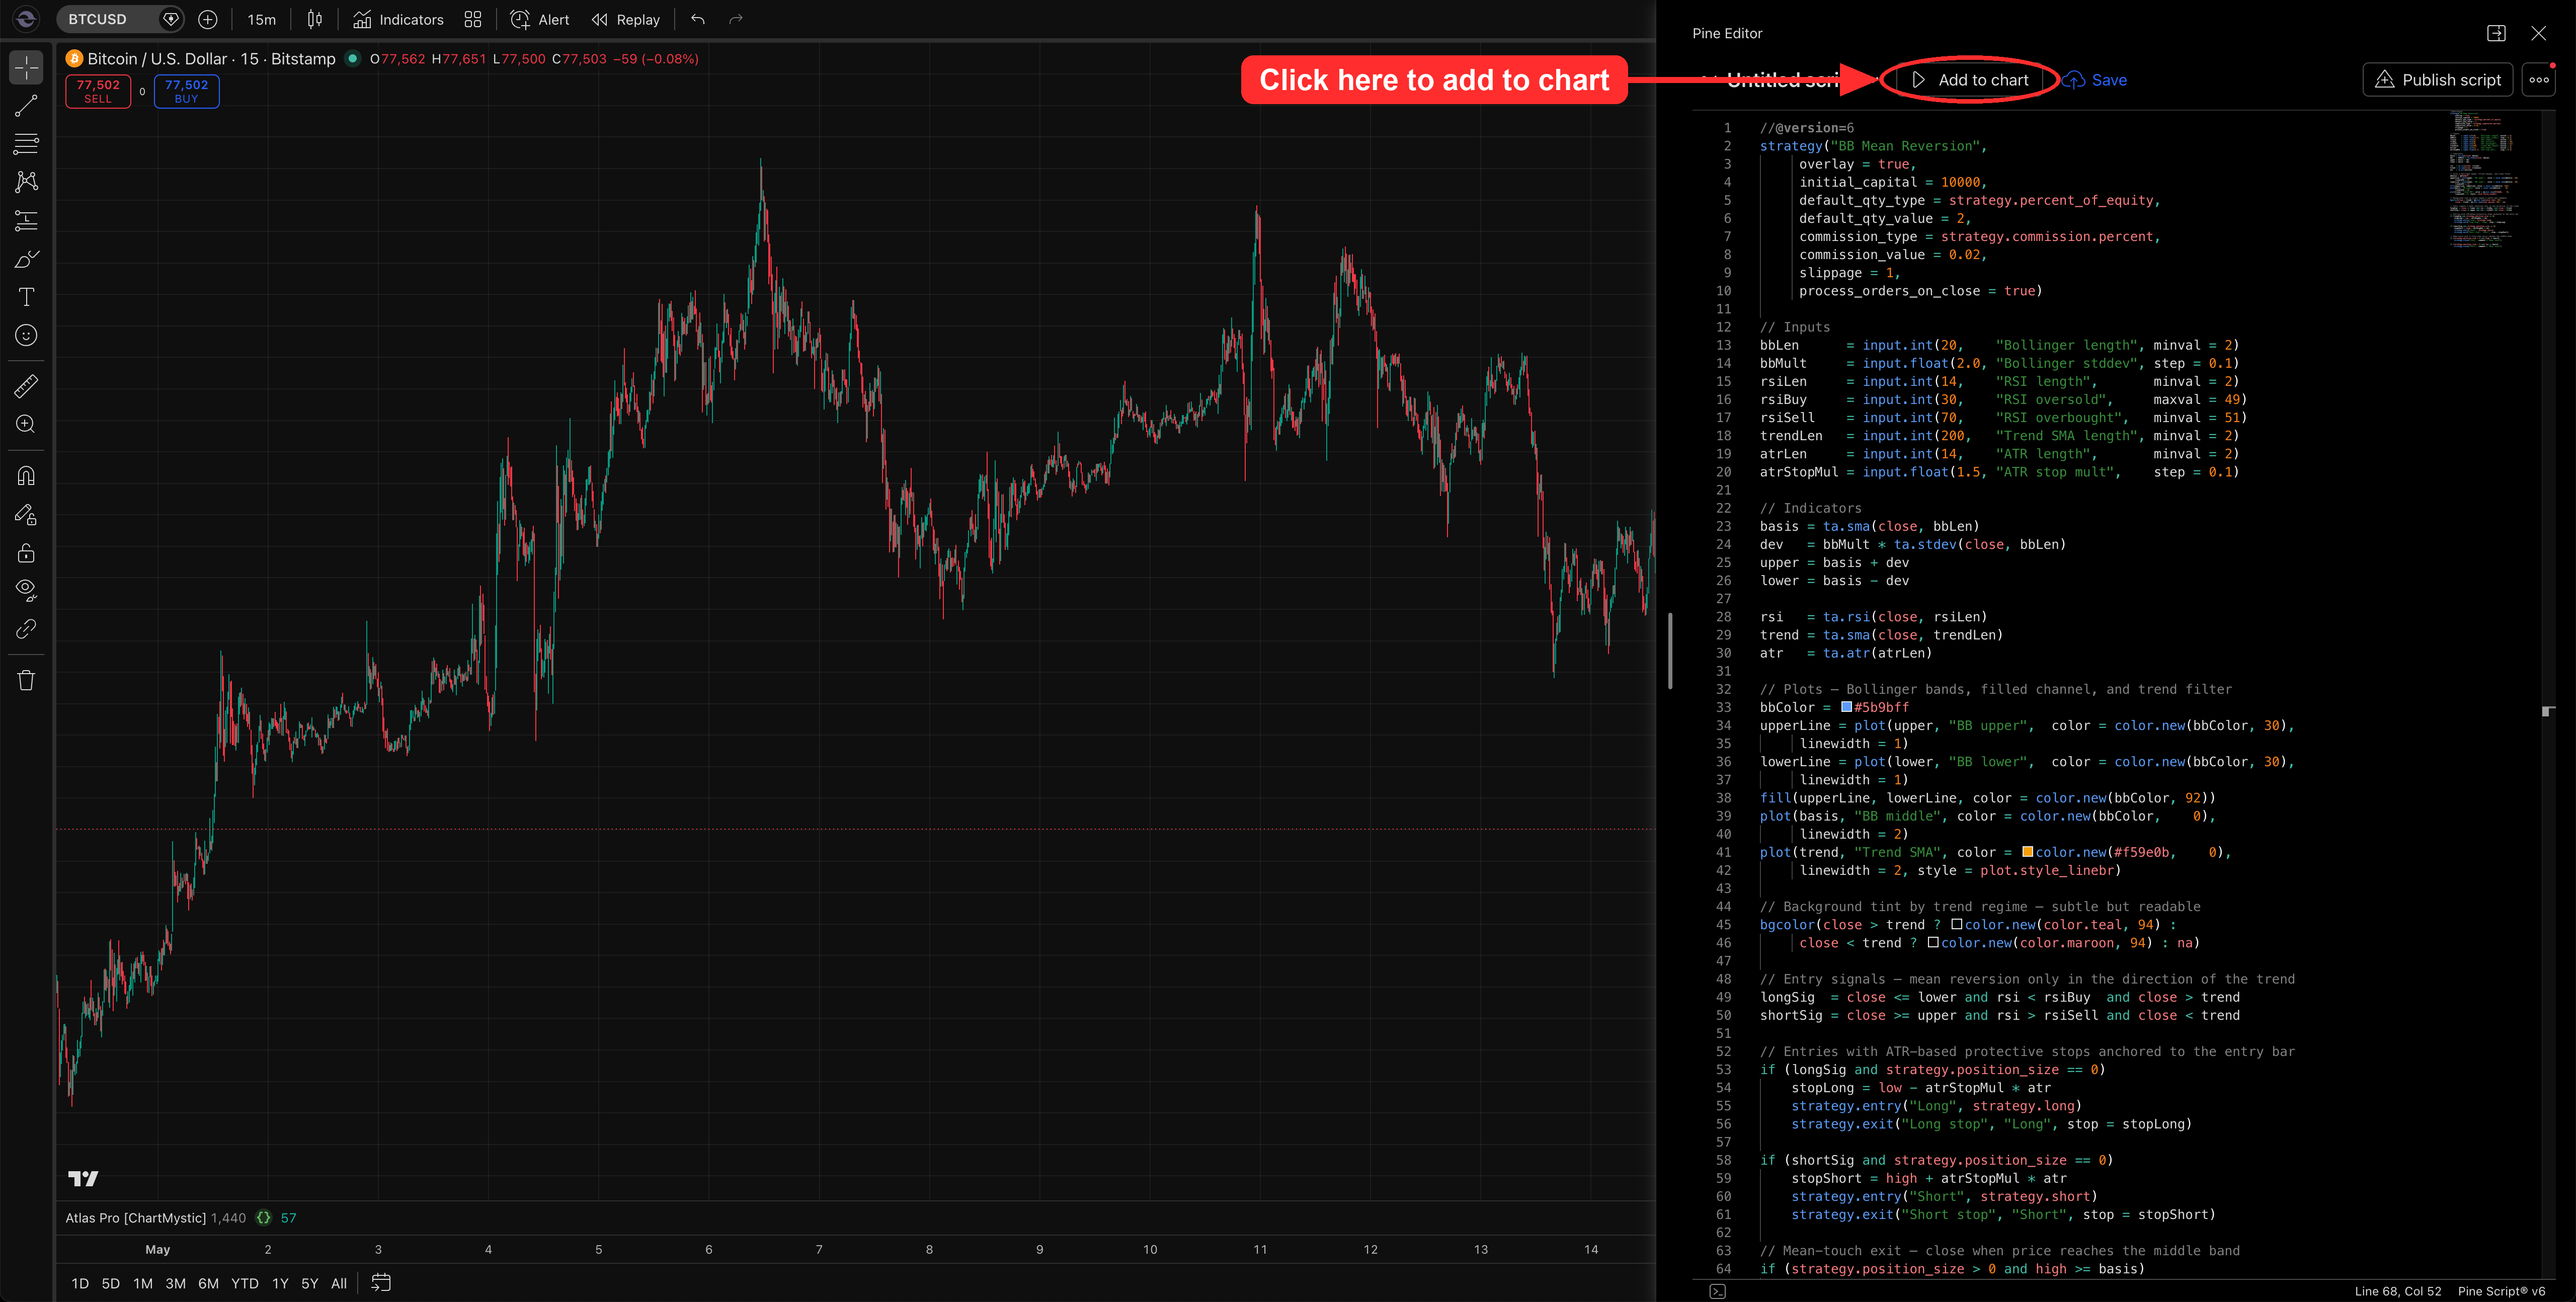
Open Strategy Tester and review. Strategy Tester populates automatically once the strategy is on the chart. Review net P&L, max drawdown, total trades, and profit factor before trusting anything.
Review repainting before trusting any strategy
Strategies can look better than they behave if they use future-looking logic. Ask Scribe to review whether the script uses request.security(), whether lookahead is disabled, whether entries wait for confirmed bars when intended, and whether alerts and strategy entries use the same timing.
Avoid curve fitting
Do not keep changing rules until historical results look perfect. A strategy that is overfit to the past usually fails in live conditions — sometimes spectacularly. Review multiple symbols, multiple timeframes, and multiple market regimes. Use realistic commission and slippage. Keep the rules simple enough to explain in two sentences.
A Complete Walkthrough
Here is what one full strategy session looks like end-to-end. The idea: test a Bollinger Band mean-reversion setup on daily equity ETFs, but only with the prevailing trend — so we are buying dips in confirmed uptrends and selling rips in confirmed downtrends.
1. The prompt
The opening prompt
Create a Pine Script strategy for TradingView.
Context
Daily chart on equity index ETFs like SPY and QQQ.
Goal
I want to buy oversold pullbacks inside confirmed uptrends and short overbought rallies inside confirmed downtrends — basic mean reversion, but only with the trend, never against it. I want to know if this is a real edge or if I am just eyeballing it.
Entry rules
Go long when today's close touches or breaks below the lower Bollinger Band AND the 14-period RSI is below 30 AND price is still above the 200-day SMA. Go short on the mirror conditions: close above upper band, RSI above 70, price below the 200-day SMA. One position at a time.
Exit rules
Close the position when price touches the middle Bollinger Band — that is the mean I am reverting to.
Stop loss
1.5x the 14-period ATR beyond the entry bar's extreme. For a long, the stop is the entry bar's low minus 1.5 ATR. For a short, the entry bar's high plus 1.5 ATR.
Take profit
None. The middle-band exit is the only profit target.
Position sizing
2 percent of equity per trade.
Inputs
Let me adjust the Bollinger length and stddev, the RSI length and thresholds, the trend SMA length, the ATR length, and the ATR stop multiplier. Defaults: 20 / 2.0, 14 / 30 / 70, 200, 14, 1.5x.
Backtest realism
0.02 percent commission per trade and 1 tick slippage — typical for an equity broker on SPY-class symbols.
Safety
Use bar-close confirmation. Flag any repainting concerns, especially around the RSI calculations and the ATR-based stop placement.
2. Scribe's response
Scribe returns a complete strategy that addresses every section of the prompt.
//@version=6strategy("BB Mean Reversion", overlay = true, initial_capital = 10000, default_qty_type = strategy.percent_of_equity, default_qty_value = 2, commission_type = strategy.commission.percent, commission_value = 0.02, slippage = 1, process_orders_on_close = true) // InputsbbLen = input.int(20, "Bollinger length", minval = 2)bbMult = input.float(2.0, "Bollinger stddev", step = 0.1)rsiLen = input.int(14, "RSI length", minval = 2)rsiBuy = input.int(30, "RSI oversold", maxval = 49)rsiSell = input.int(70, "RSI overbought", minval = 51)trendLen = input.int(200, "Trend SMA length", minval = 2)atrLen = input.int(14, "ATR length", minval = 2)atrStopMul = input.float(1.5, "ATR stop mult", step = 0.1) // Indicatorsbasis = ta.sma(close, bbLen)dev = bbMult * ta.stdev(close, bbLen)upper = basis + devlower = basis - dev rsi = ta.rsi(close, rsiLen)trend = ta.sma(close, trendLen)atr = ta.atr(atrLen) // Plots — Bollinger bands, filled channel, and trend filterbbColor = #5b9bffupperLine = plot(upper, "BB upper", color = color.new(bbColor, 30), linewidth = 1)lowerLine = plot(lower, "BB lower", color = color.new(bbColor, 30), linewidth = 1)fill(upperLine, lowerLine, color = color.new(bbColor, 92))plot(basis, "BB middle", color = color.new(bbColor, 0), linewidth = 2)plot(trend, "Trend SMA", color = color.new(#f59e0b, 0), linewidth = 2, style = plot.style_linebr) // Background tint by trend regime — subtle but readablebgcolor(close > trend ? color.new(color.teal, 94) : close < trend ? color.new(color.maroon, 94) : na) // Entry signals — mean reversion only in the direction of the trendlongSig = close <= lower and rsi < rsiBuy and close > trendshortSig = close >= upper and rsi > rsiSell and close < trend // Entries with ATR-based protective stops anchored to the entry barif (longSig and strategy.position_size == 0) stopLong = low - atrStopMul * atr strategy.entry("Long", strategy.long) strategy.exit("Long stop", "Long", stop = stopLong) if (shortSig and strategy.position_size == 0) stopShort = high + atrStopMul * atr strategy.entry("Short", strategy.short) strategy.exit("Short stop", "Short", stop = stopShort) // Mean-touch exit — close when price reaches the middle bandif (strategy.position_size > 0 and high >= basis) strategy.close("Long", comment = "Mean touch") if (strategy.position_size < 0 and low <= basis) strategy.close("Short", comment = "Mean touch") 3. Final result
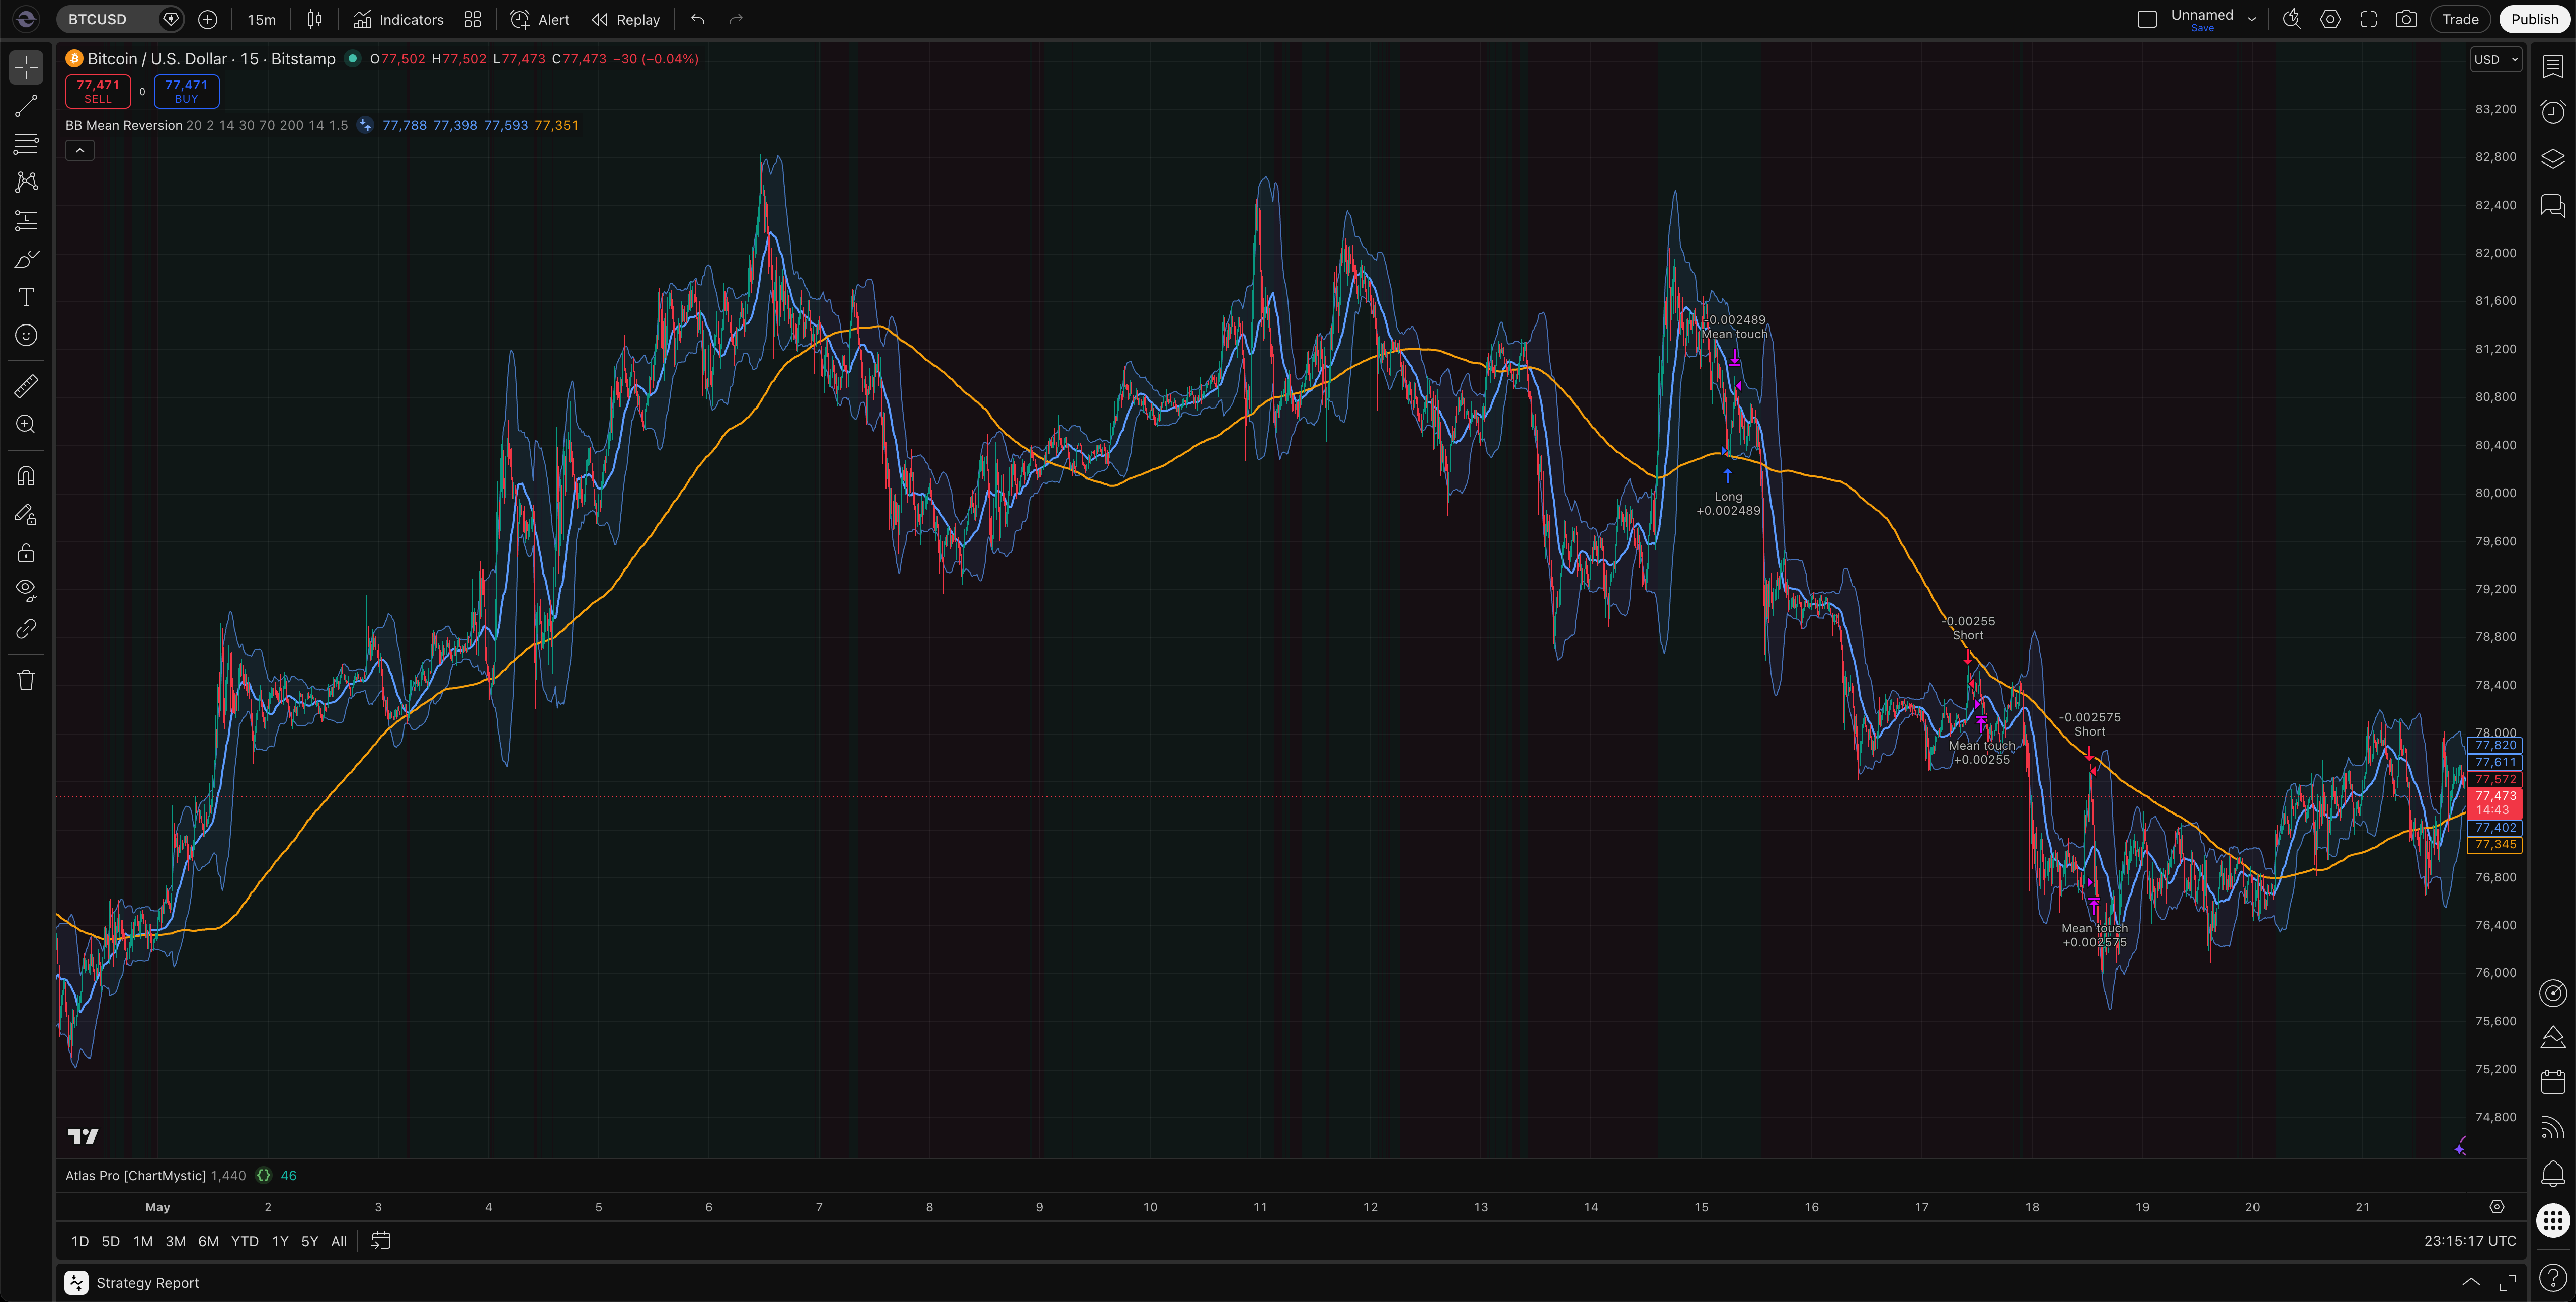
Here's the strategy running on a BTCUSD 15-minute chart. The Bollinger Bands wrap the price action, the 200-period SMA acts as the trend filter, and every simulated trade is marked with an entry arrow at the band touch and an exit arrow when price tagged the middle band or the ATR stop. The Strategy Tester sits collapsed at the bottom of the panel, ready to open into the full performance report.
Reading The Backtest Results
Generating the strategy and adding it to a chart is only half the loop. Once it is live in TradingView, the Strategy Tester panel underneath the chart holds the report that actually tells you whether the idea has an edge — net P&L, max drawdown, win rate, profit factor, the equity curve, and a trade-by-trade breakdown.
Interpreting that report well is its own skill: which metrics matter, which ones mislead, how to tune the Properties tab for realistic commission and slippage, and how to forward test before risking real money. We cover all of it on a dedicated page.
See Backtest In TradingView for the full walkthrough of opening the Strategy Tester, reading the Overview tab, digging into the detailed tabs, and forward testing the strategy before you trade it.