Backtest In TradingView
Run a Scribe Studio strategy through TradingView's Strategy Tester and read the performance report.
TradingView's Strategy Tester replays your script bar-by-bar across history and produces a full performance report — simulated trades, P&L, drawdown, win rate, equity curve, and a list of every trade. This page walks you through the loop, from generating a backtestable script to reading and refining the report.
You can only backtest strategies, not indicators
The Strategy Tester only works with strategies. Indicators show information on the chart but never open or close positions, so there is nothing for the tester to replay. If you want a performance report, you need a strategy.
A backtest is a hypothesis test, not a guarantee
A clean equity curve over five years of historical data tells you the rules survived one specific past. It does not tell you they will survive the next one. Treat every backtest as evidence, not as a prediction.
1. Generate a strategy in Scribe Studio
Scribe Studio turns a plain-English description of your trading idea into a full Pine strategy that's ready to test in TradingView.
We have a complete guide for this in Generate A Strategy — it covers the prompt template, the full workflow, and the steps for loading the generated script into TradingView's Pine Editor and adding it to a chart. Read that first, then come back here once your strategy is loaded into TradingView and Strategy Tester is open below the chart.
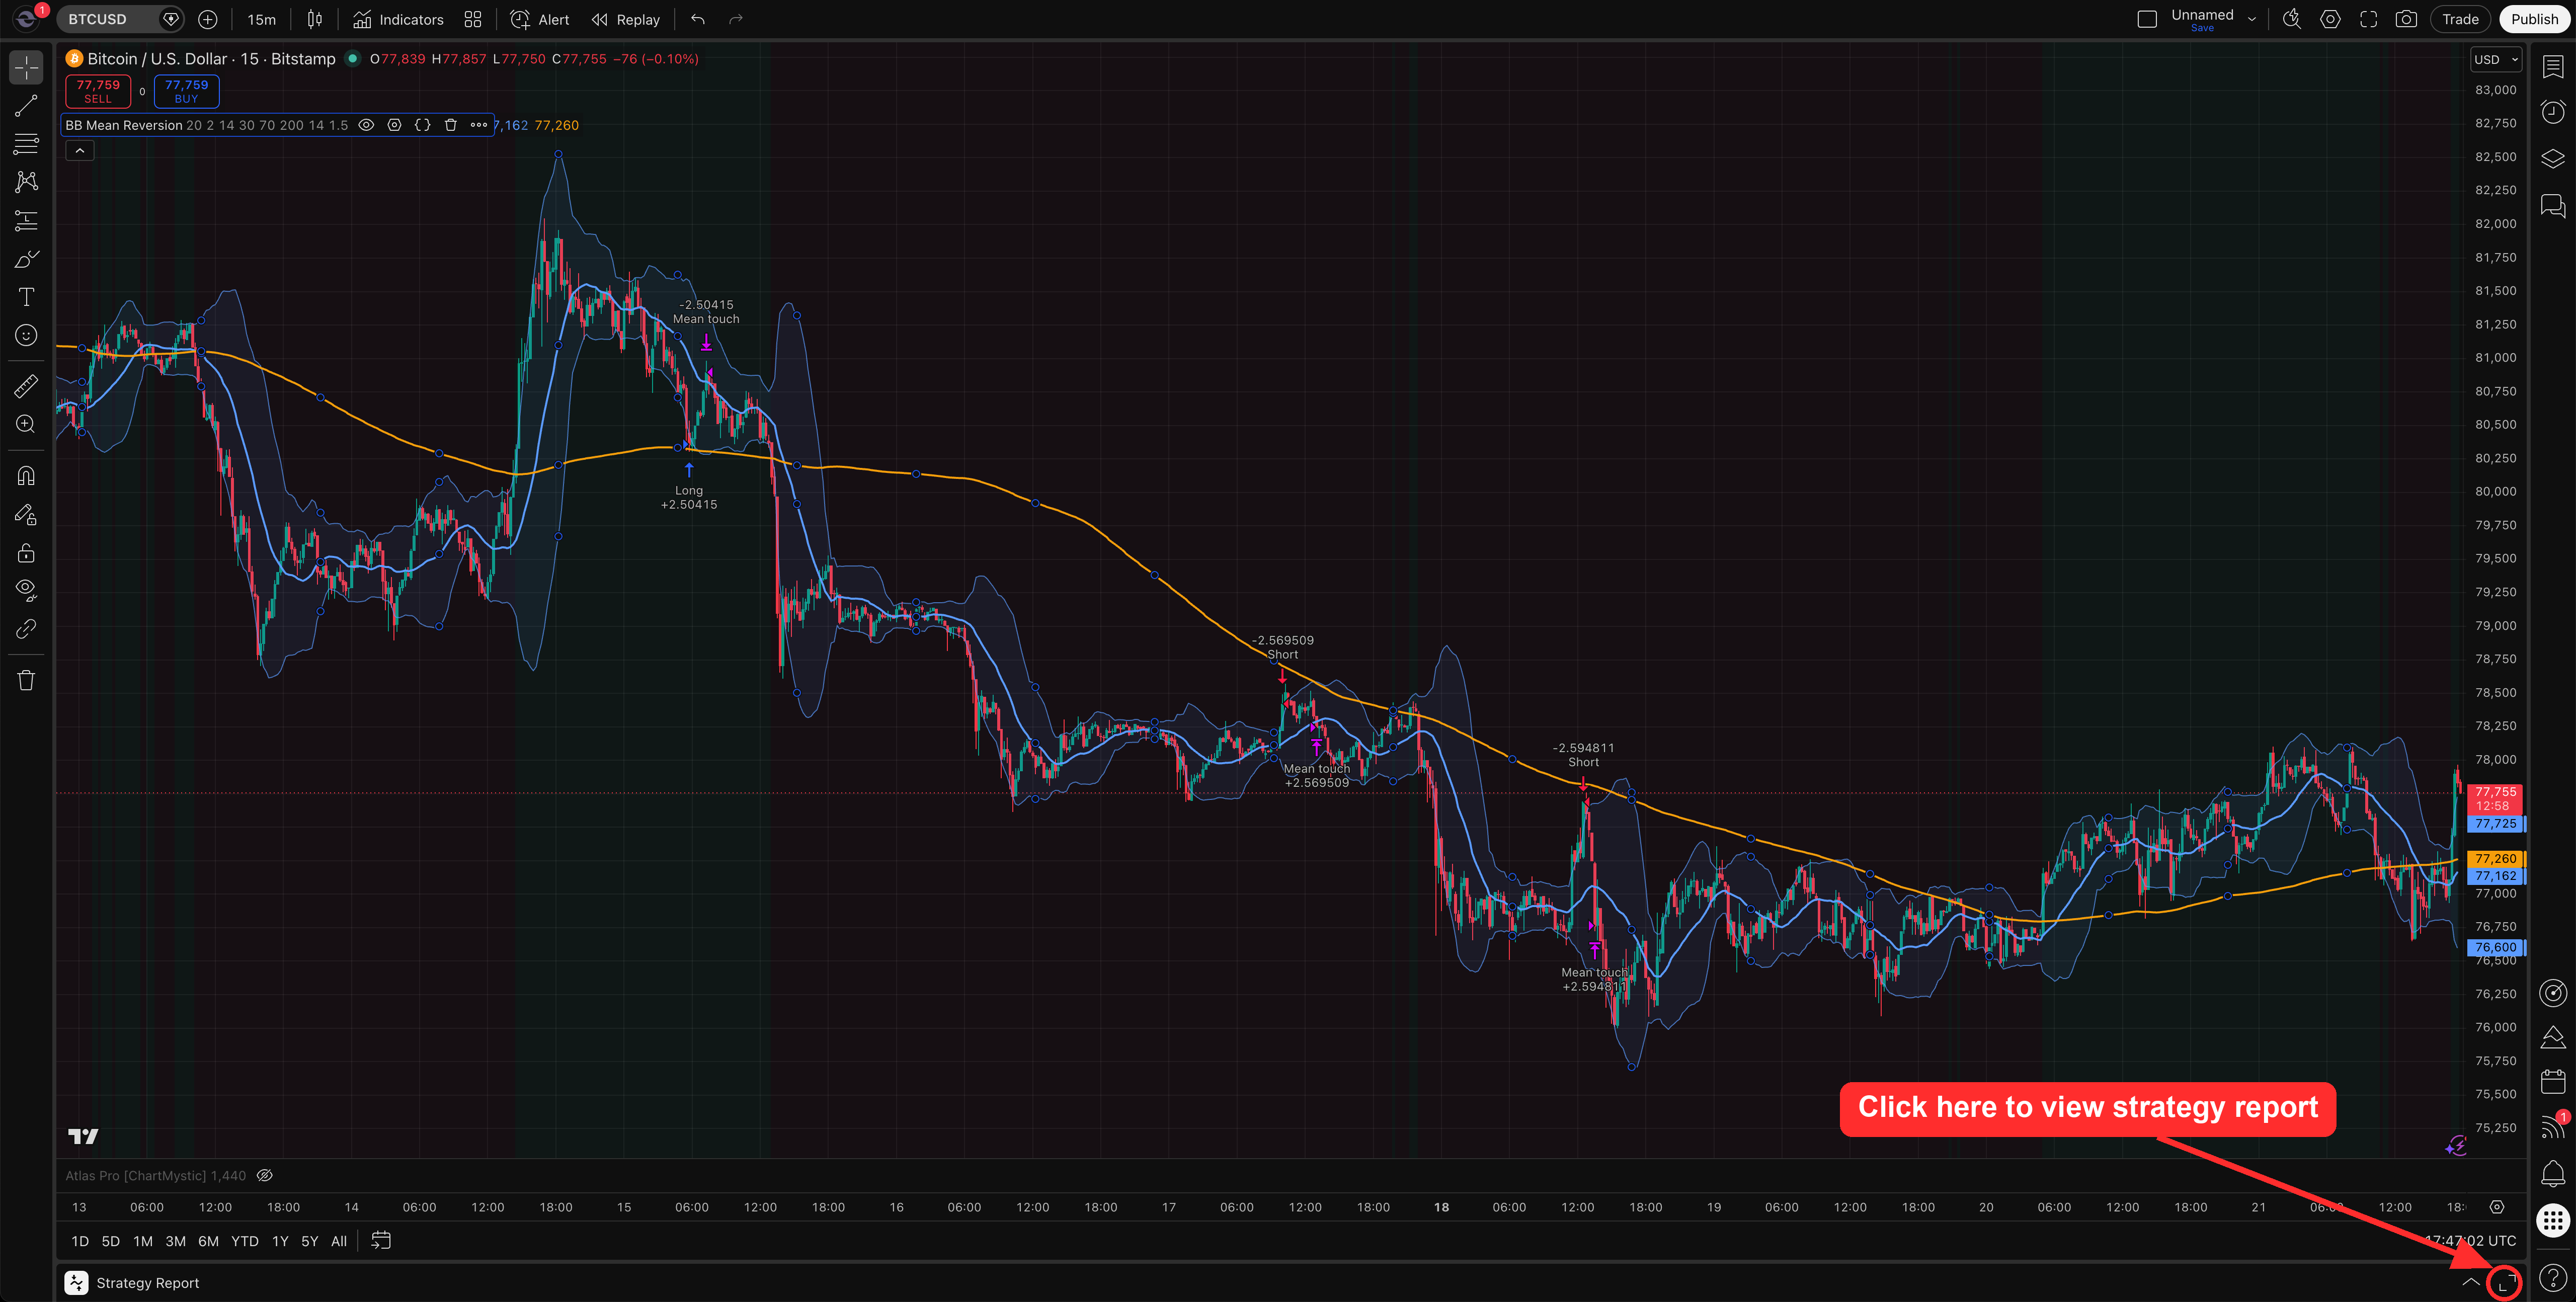
2. Open Strategy Tester
The moment a strategy is on the chart, Strategy Tester appears in the panel at the bottom of the screen, alongside Pine Editor and the symbol search. There is no Run button — the tester populates automatically.
If the panel isn't visible, click Strategy Tester in the tab bar at the bottom. The chart itself will also show colored directional arrows marking every simulated entry and exit, anchored to the bar where the order would have fired.
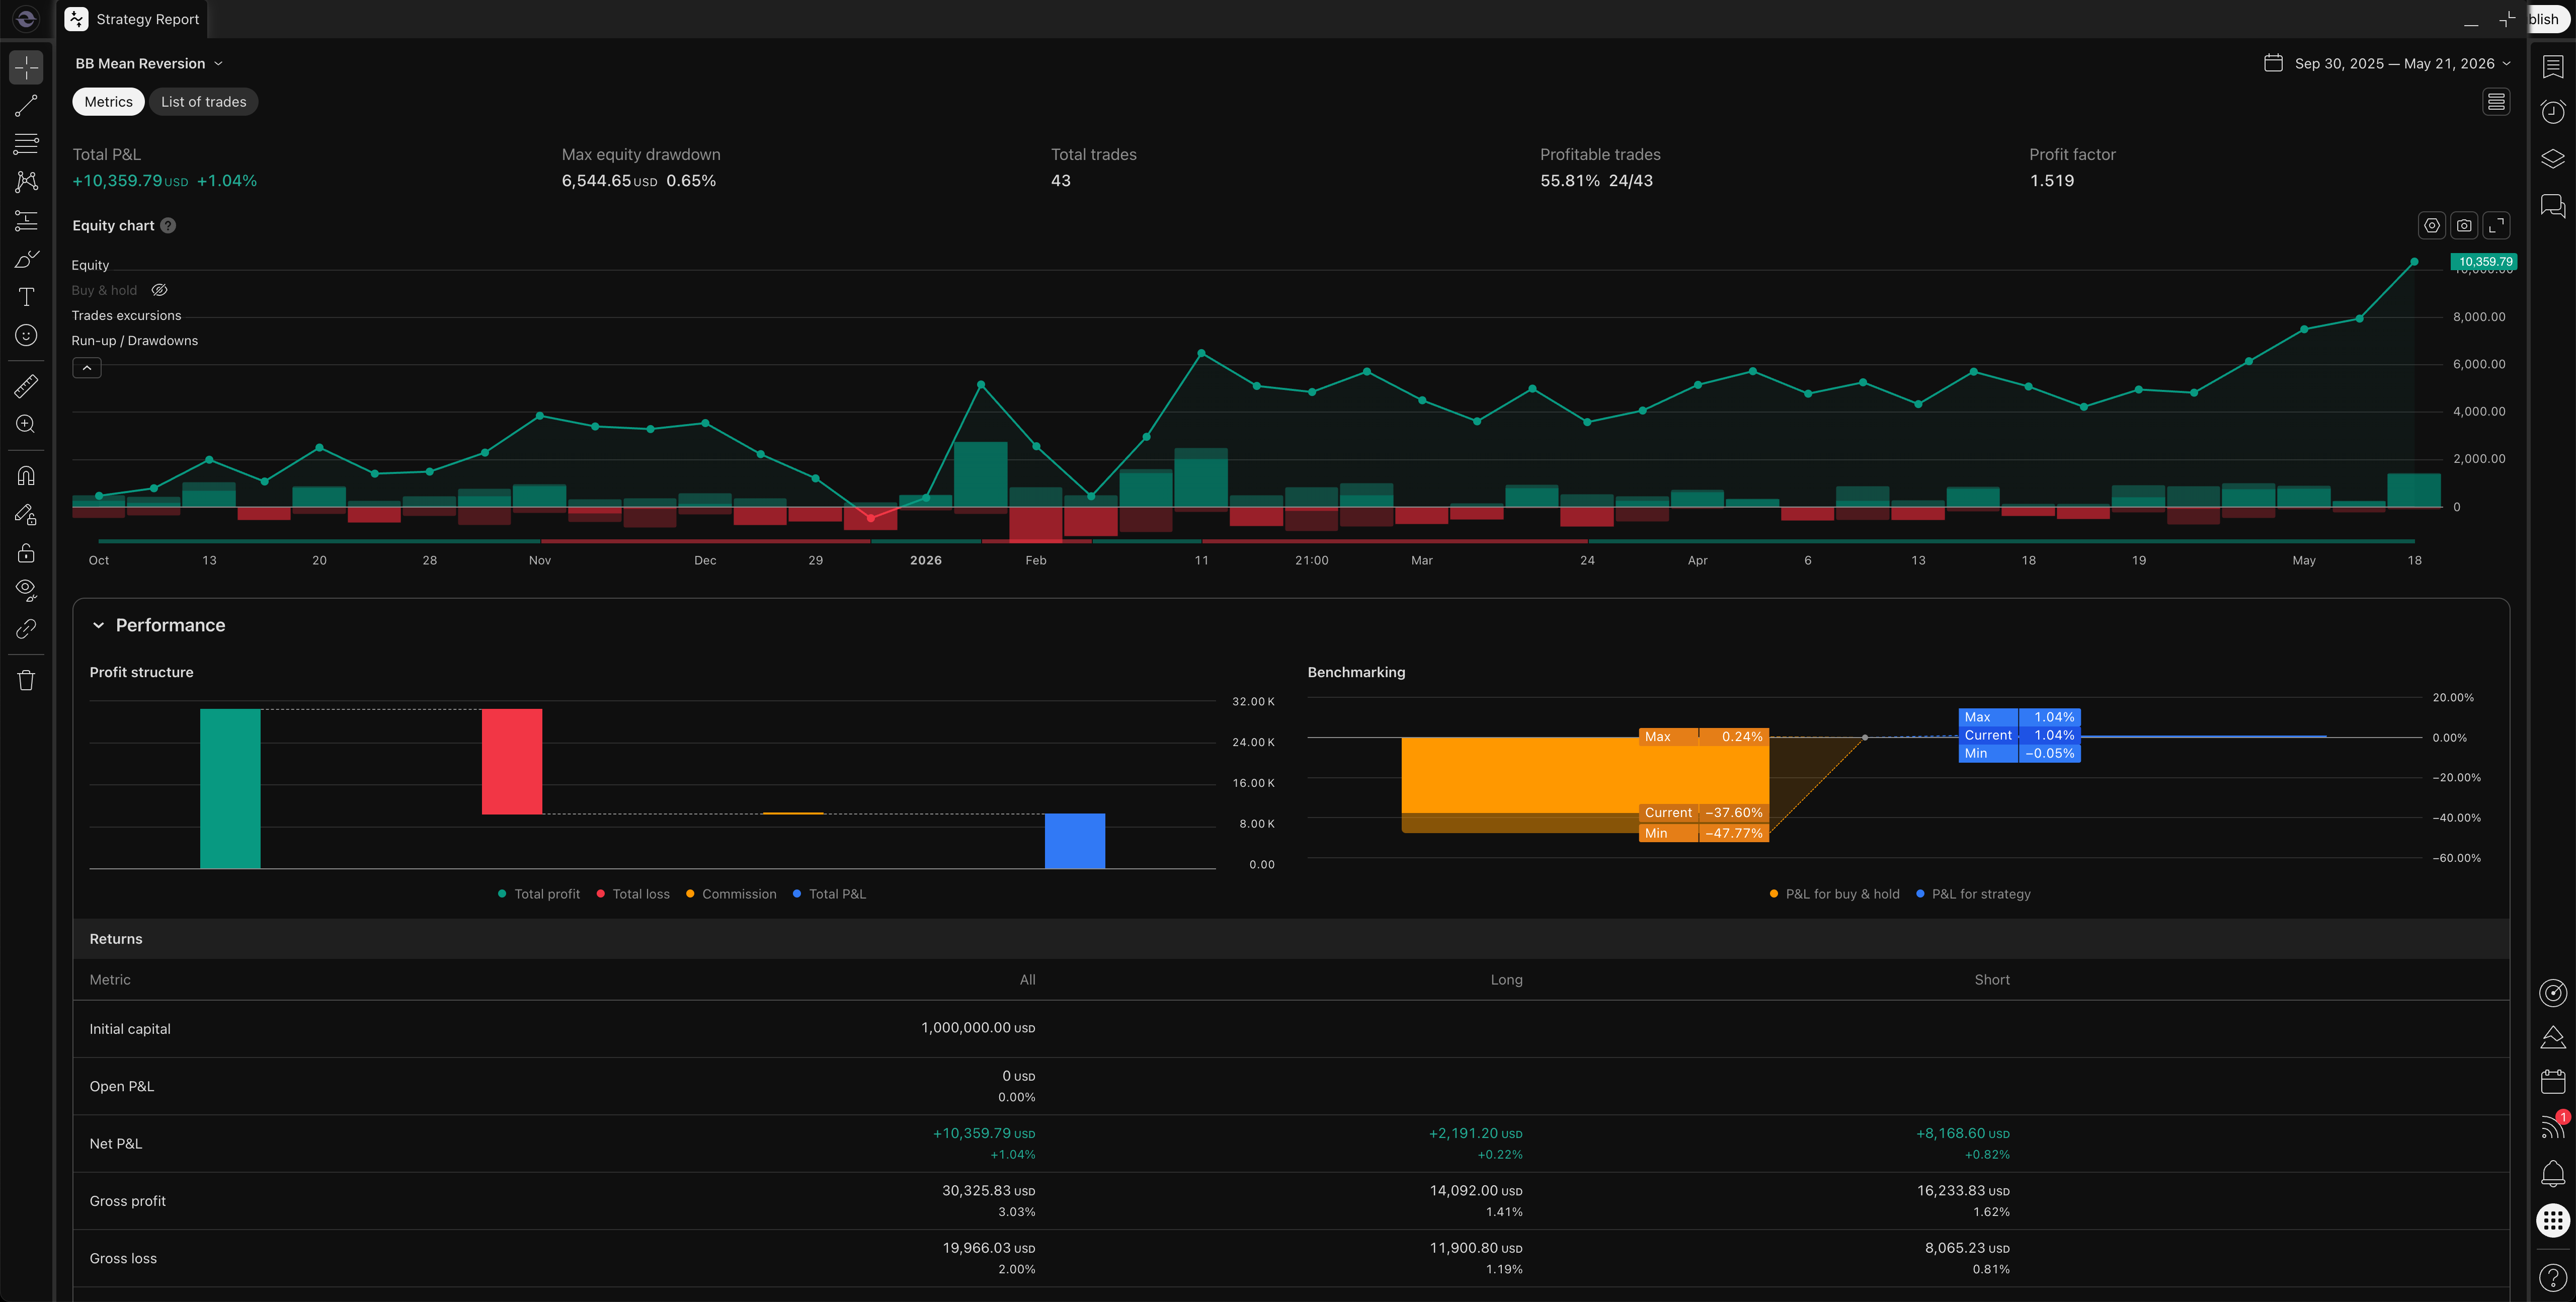
3. Read the Overview tab
The Overview tab is the fastest way to decide whether a strategy is worth deeper review. It surfaces the headline metrics and the equity curve in one view.
| Metric | What it tells you | Watch out for |
|---|---|---|
| Net profit | Total dollar P&L after fees | A large number means little without trade count and drawdown context |
| Max equity drawdown | The worst peak-to-trough equity decline | Anything you would not personally sit through in live trading |
| Total trades | Sample size of the test | Under ~30 trades, no metric is statistically meaningful |
| Percent profitable | Win rate | A high win rate with tiny wins and large losses still loses money |
| Profit factor | Gross profit divided by gross loss | Above 1.5 is healthy; below 1.0 means losses exceed wins |
| Equity curve | Visual P&L progression | Smooth and rising beats jagged and lumpy, even at the same final profit |
| Average trade | Mean P&L per trade | Must clearly exceed commission + slippage to be real |
Read these together, not in isolation. A strategy can win often and still lose money if losing trades are too large. Profit factor can look healthy while drawdown is uncomfortable. The equity curve can look attractive while the number of trades is too small to trust.
If the Overview looks promising, move on to refining the strategy. If it doesn't, the rules need work before any of the headline numbers matter — revisit the prompt in Scribe.
Refining Your Strategy
Once the Overview looks worth investigating, two places sharpen the picture.
Dig into the detailed tabs
The Overview tab is a summary. The other tabs explain why the summary looks the way it does.
- Performance — deeper profit, loss, fee, and risk statistics broken down by side, by hold time, by month.
- Trades analysis — win/loss breakdown, average winner vs average loser, max consecutive runs.
- List of trades — every simulated trade with its entry, exit, size, price, and result. Click any row to jump to that trade on the chart.
The List of trades is the highest-signal tab once a strategy starts looking interesting. Inspect a handful of entries and exits on the chart — they should match the rules you asked Scribe to build. If they don't, the strategy needs a fix before any of the headline numbers matter.
Tune Strategy Properties
Open the strategy's settings (gear icon next to its name in the chart legend) and switch to the Properties tab. This is where realistic test assumptions live, and where most strategies need tuning before the report can be trusted.
- Initial capital — set it to something realistic for your account size.
- Order size — percent of equity, fixed contracts, or fixed dollar amount.
- Commission — match your broker's actual fee schedule.
- Slippage — a few ticks for liquid markets, more for thin ones.
- Pyramiding — how many concurrent positions in the same direction. Most strategies should stay at 1.
- Margin — required for leveraged tests.
- Date range — if the strategy includes date inputs, restrict the backtest window here.
If any of these are missing or hardcoded in the script, paste the strategy back into Scribe and ask for them as configurable inputs.
Avoid overfitting
Do not keep changing inputs until the past looks perfect. The same set of rules that produce a flawless backtest on one symbol and one date range often fail catastrophically on the next. Simple rules that survive multiple charts, multiple timeframes, and multiple market regimes are usually more useful than complex rules that win on one.
Good Backtesting Habits
Test more than one chart
A strategy that only works on one symbol or one tiny date range is fragile. Run the same strategy across similar symbols and adjacent timeframes before trusting it.
Respect costs
Use realistic commission and slippage in Properties. A high-frequency strategy can look great before costs and lose money after.
Forward test before live
Once a strategy passes the backtest review, run it on paper or at tiny size for a stretch of future bars before scaling up. Past performance you can curve-fit. Future bars you cannot.
Review trade logic
Open the List of trades and inspect entries and exits on the chart. Confirm the trades match the rules you asked Scribe to build — not a misread of the prompt.
Going Further
This page covers the essentials — opening the Strategy Tester, reading the headline metrics, and refining the strategy. That is enough to evaluate most strategies Scribe Studio generates.
TradingView's Strategy Tester goes considerably deeper than what we walk through here. The Properties tab alone exposes a long list of settings — recalculation behavior, fill assumptions, bar-magnifier precision, margin and pyramiding rules, currency conversion, and more — and the report itself can be analyzed in ways this guide does not get into. Covering every option is outside the scope of these docs.
If you want to go deep on backtesting and strategy report configuration, TradingView maintains its own dedicated documentation. See TradingView's Strategies documentation for the full reference.