Liquidity Levels
See where buy-side and sell-side liquidity may matter around the active setup.
Price drives below an obvious cluster of lows, sweeps the stops sitting there, then reclaims back inside the range on the next bar. That is the moment a liquidity sweep matters. Not the level itself — the behavior around it.
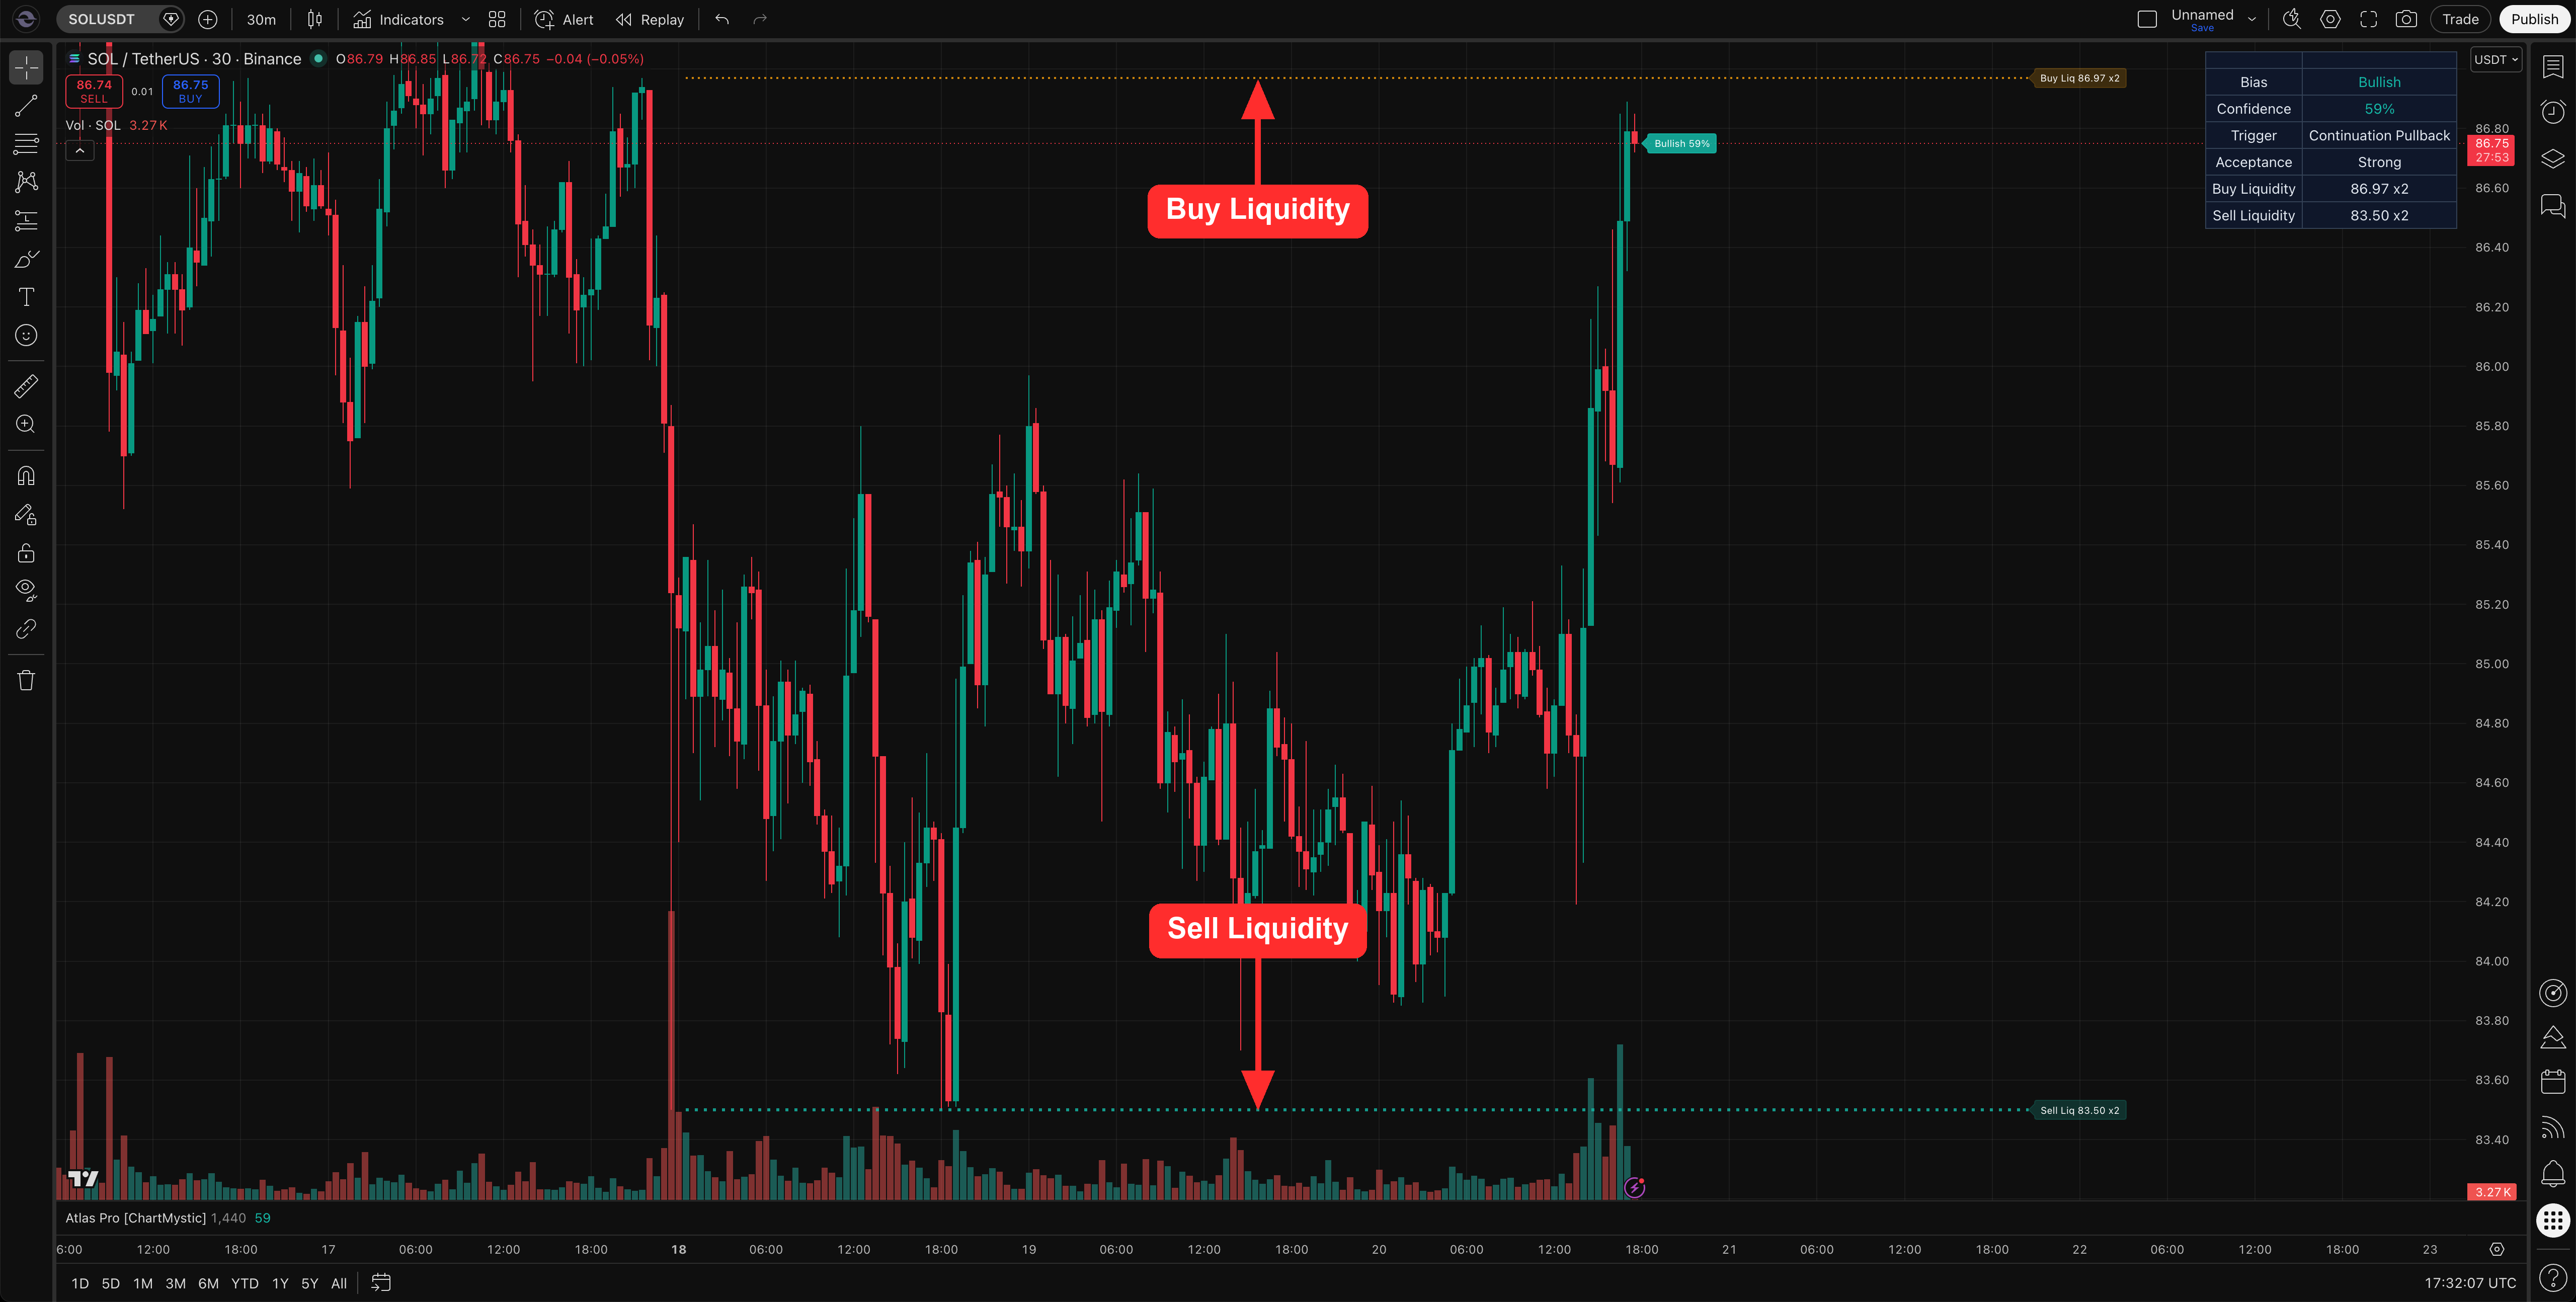
Liquidity Levels mark the areas where resting orders are most likely to cluster: obvious highs, obvious lows, equal highs, equal lows, prior session highs and lows, prior day and week extremes. Atlas Pro draws these so you can see the targets price tends to gravitate toward and the moments when reclaim behavior changes the read.
Liquidity Levels mark buy-side and sell-side liquidity pools on the chart — the price areas where stop orders cluster and price often gets pulled toward.
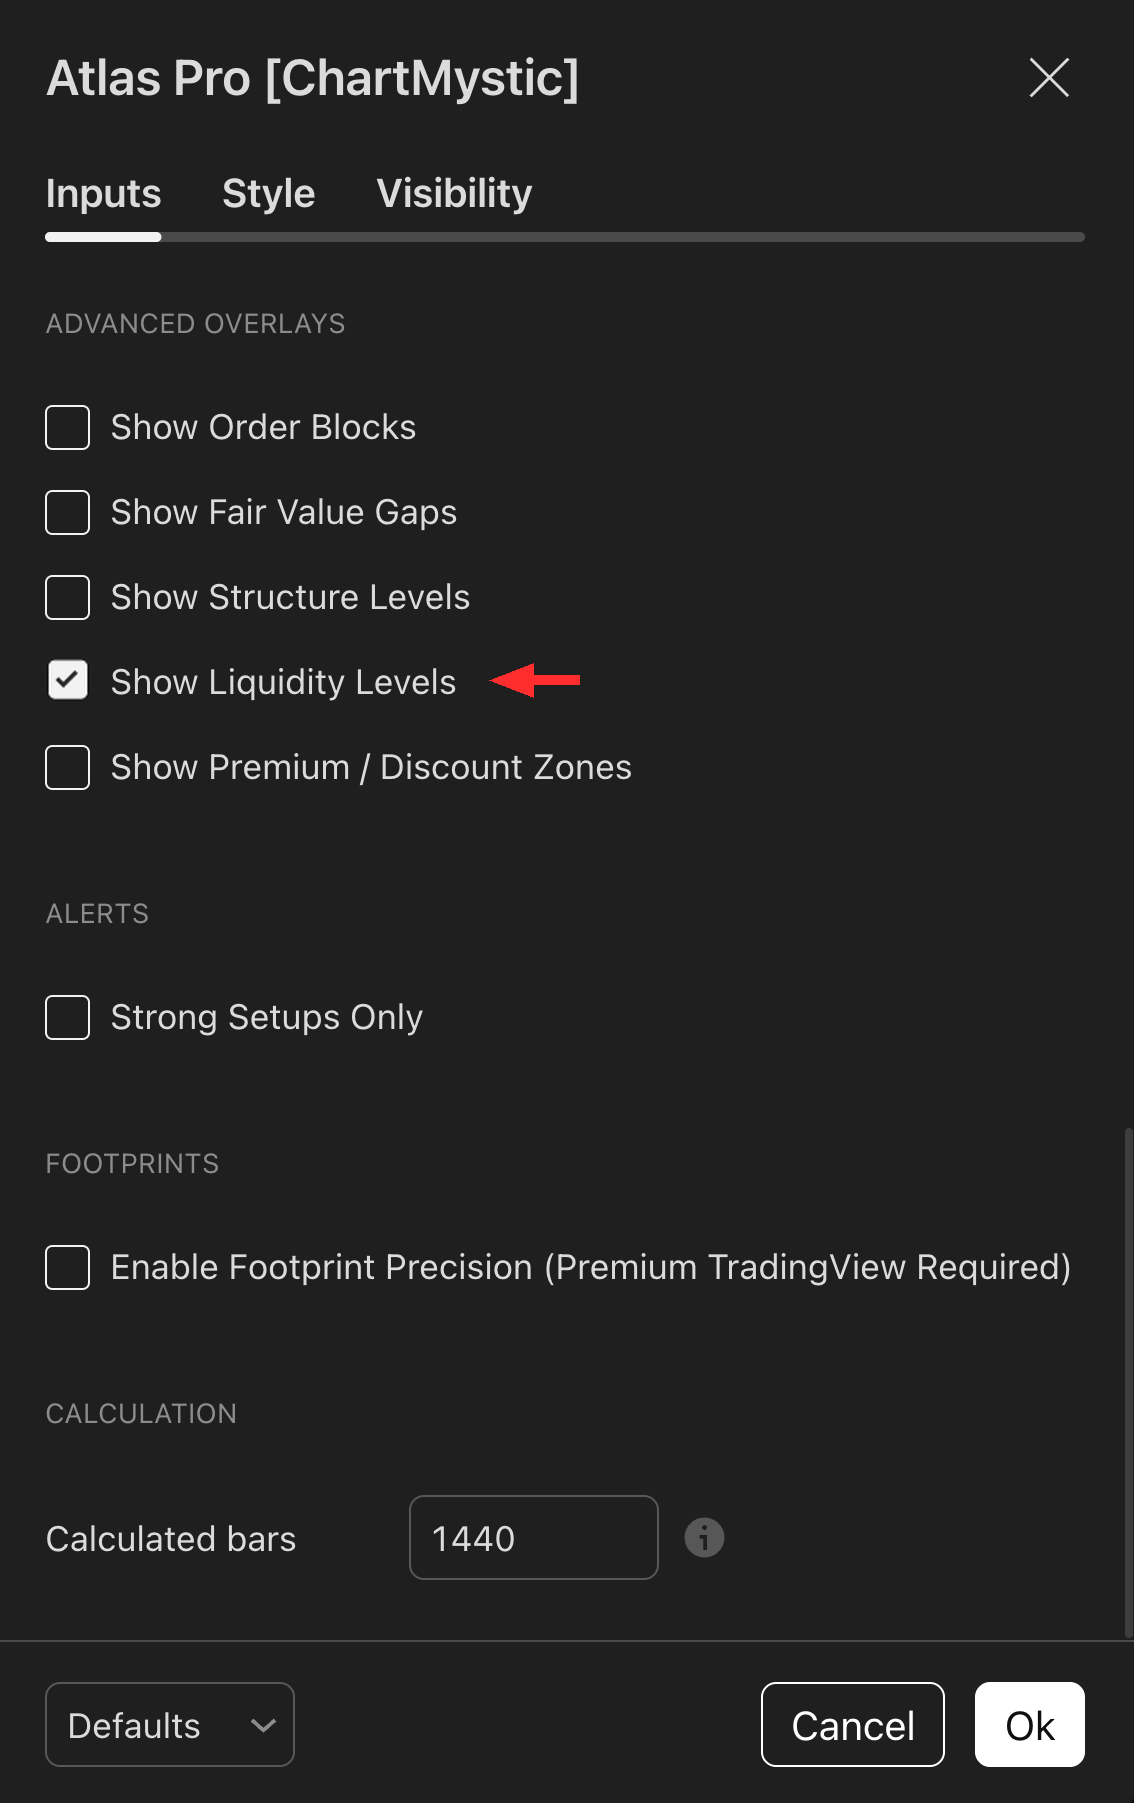
Enable Show Liquidity Levels under the Advanced Overlays section to render them. Atlas Pro prioritizes the most active unswept pools, so the chart stays readable rather than crowded.
What Liquidity Levels Represent
Buy-side liquidity typically sits above highs — that is where short stops and breakout buy orders rest. Sell-side liquidity typically sits below lows — that is where long stops and breakdown sell orders rest. Price hunts these areas because they are the deepest pools of fillable orders.
Atlas Pro draws both sides as references, then weights them by clustering.
Pool Prioritization
A single isolated equal high is one level of liquidity. Three equal highs at the same price, plus a prior session high one tick away, is a pool. Pools attract more participation than isolated levels — and Atlas Pro prioritizes the highest-value unswept pools when deciding what to render. Already-swept pools fall off; fresh pools surface.
The dashboard's Buy Liquidity and Sell Liquidity rows show the nearest pool of each side along with the cluster count, so you can read the depth of the target without manually counting touches on the chart.
How Atlas Pro Uses Liquidity Levels
Liquidity matters most around triggers. A sweep, rejection, reclaim, or failure at a liquidity pool can change how the engine reads a setup. A bullish reversal trigger printed after a clean sell-side sweep and reclaim carries more weight than the same trigger printed in open space. A bearish continuation trigger driving into deep buy-side liquidity may stall or reverse, regardless of how clean the pattern looks.
How To Enable Liquidity Levels
- Open Atlas Pro settings.
- Go to Advanced Overlays.
- Toggle Show Liquidity Levels on.
How To Use Liquidity Levels
Liquidity helps explain four common chart moments:
- Why price is gravitating toward a level even when nothing else is happening.
- Why a sweep and reclaim is the trigger that matters, not the sweep alone.
- Why a confirmed setup may need extra confirmation when price has just taken liquidity in the opposite direction.
- Why the current read can shift as price approaches or rejects a pool.
A liquidity level can attract price. It does not dictate what happens after price gets there.
Example Use
Price grinds below an obvious cluster of equal lows, taps sell-side liquidity, and the very next bar closes back above the swept level. Atlas Pro confirms Bullish 71% with Strong acceptance two bars later. The sweep-and-reclaim is the context the setup was waiting for.
Price drives straight into a deep buy-side pool above with no rejection, no sweep, no reclaim. Watch acceptance carefully — moves into untouched liquidity often stall, regardless of how strong the leg into the pool looked.
Common mistakes
- Trading the sweep, not the reclaim. Price tagging a level is half the event. Reclaim back through it is what flips the read.
- Treating every line as load-bearing. Old, distant, or already-swept levels matter less than fresh, clustered, unswept pools.
- Front-running into liquidity. Selling into untouched buy-side liquidity below an obvious resistance, or buying into untouched sell-side liquidity above an obvious support, fights the most likely next move.